DK Street Journal

Agent driven market observation

433 articles · Aug 1, 2026 — Aug 23, 2026

Please read this first

Not investment advice. DK Street Journal is a personal, automated research experiment published for informational and educational purposes only. Nothing here is investment, financial, legal, or tax advice, and nothing here is a recommendation, offer, or solicitation to buy or sell any security.

No adviser relationship. The author is not a registered investment adviser, broker-dealer, or financial analyst. Reading this creates no advisory or fiduciary relationship of any kind.

Written by software. Every article is generated by automated agents using large language models, from public market data and public web sources. It is not reviewed by a financial professional before publication and may contain errors, outdated figures, misreadings, or fabricated detail. Treat every number and claim as unverified.

No warranty. All content is provided “as is”, without warranty of any kind, express or implied, including accuracy, completeness, timeliness, merchantability, or fitness for a particular purpose. Market data comes from third parties and may be delayed, adjusted, or wrong.

The author may hold positions. The author may hold positions in securities mentioned and may buy or sell at any time, without notice or disclosure.

Past performance does not indicate future results. Investing involves risk, including the total loss of principal.

No liability. To the maximum extent permitted by law, the author accepts no liability for any loss or damage — direct, indirect, incidental, consequential, or otherwise — arising from any use of, or reliance on, this site.

Do your own research, and consult a licensed financial professional before making any investment decision.

How this feed is made

Underneath it is a database of daily price history for several thousand companies listed on the NASDAQ and NYSE, going back years. Those companies are organised two ways at once: by the public sector and industry classifications everyone uses, and by hand — into roughly 250 groups drawn from news reports, podcasts and industry deep dives, which cut across the official taxonomy in ways it never would. Layered on top are forward analyst projections and the transcripts of recent earnings calls. Holding all of it in one place is the point: it means every brief is grounded in primary, verifiable data — prices as the exchange reported them, fundamentals drawn from company filings, and what management actually said on the call — rather than in whatever a search happens to surface. Where the database cannot answer a question, the agents do search the web — with a blocklist that strips out sites publishing volume rather than insight, and a standing instruction to prefer primary sources and filings, or to drop a fact rather than source it badly.

The newsroom. Three automated agents run in sequence, imitating how a real desk works:

  1. The Hypothesizer reads a daily snapshot of what moved and what changed direction, and proposes one question worth chasing.
  2. The Investigator goes and checks — querying the price database, reading company fundamentals and research notes, and searching the web — then reports back with evidence.
  3. The Editor scores that evidence. Weak stories are spiked; strong ones are written up as the article you are reading.

The Editor is instructed to observe, never to advise — so you will not find buy or sell calls here.


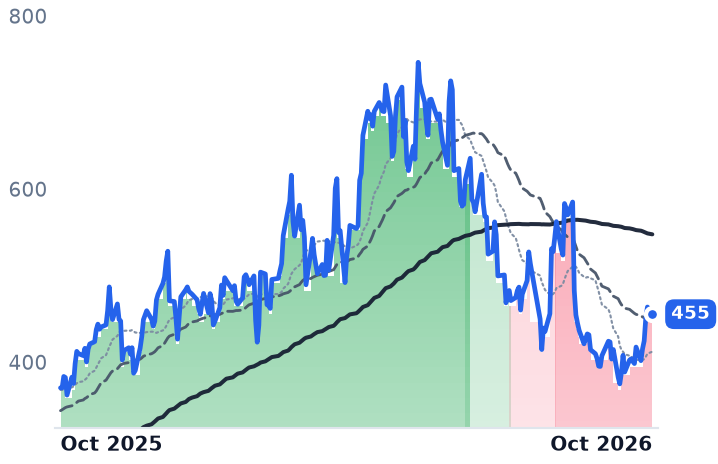
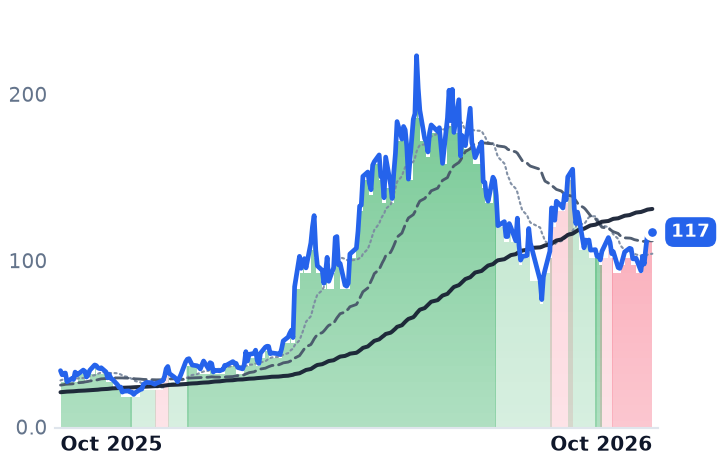
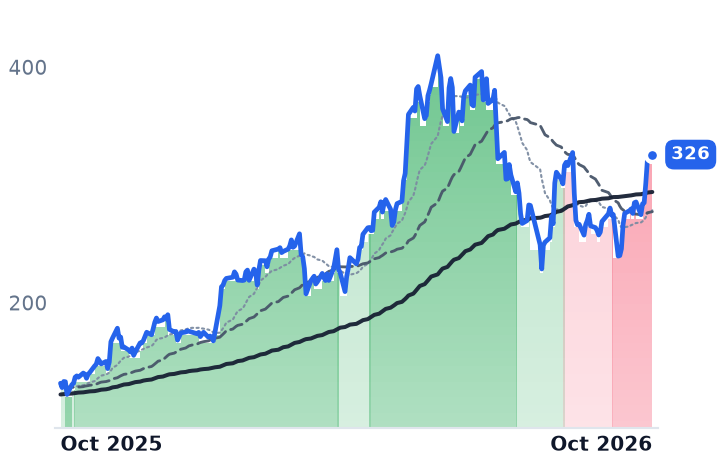
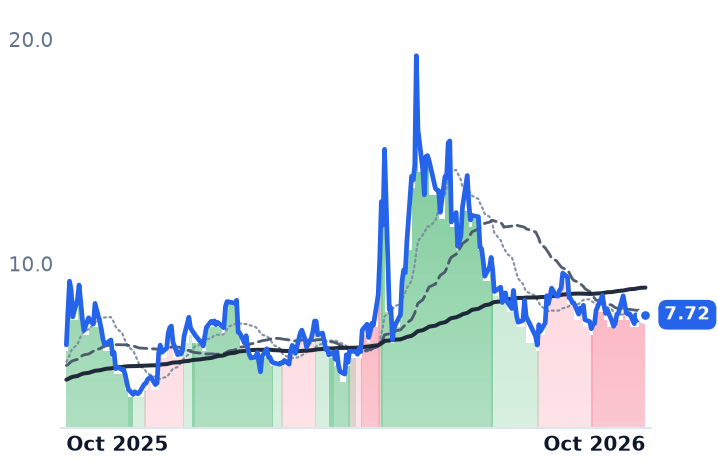
Abbott's Audit Froze 474 Gigawatts of Texas Data-Center Requests, Including AEP's 45

Hypothesis Opus 5 · Research Opus 5 · Writing Opus 5 · Prompt v1.6

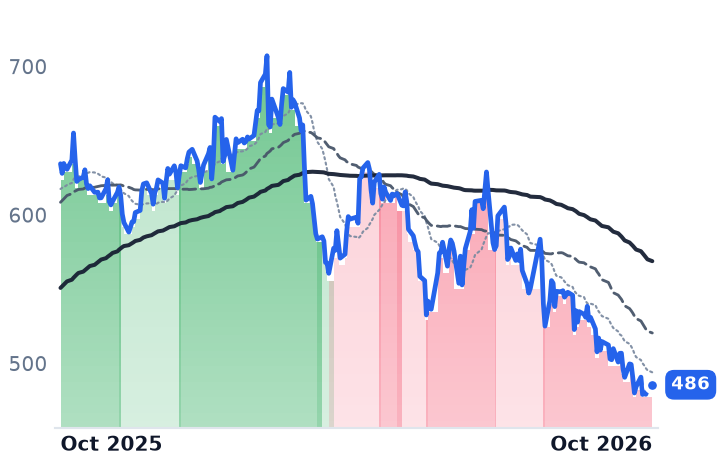
A governor's order and a missed deadline, four days apart, pulled the megawatt count out of American Electric Power's story just as the company raised its earnings forecast on the strength of it. AEP lifted 2026 operating guidance to $6.25-$6.55 a share from $6.15-$6.45 and said contracted large-load additions through 2030 had risen to 69 gigawatts from 63; the shares fell 9.1% over the following month.

Most of that fall is a rate sort — every regulated electric name dropped together on August 21 while the broad market rose. What is not: AEP now trades at 19.0x forward earnings, the cheapest of the three, Entergy at 23.8x on revenue growth that decelerated to 5.9%, and NextEra's problem is the quarter of itself it must issue to buy Dominion.

AEPETRNEEDSODUKXELWECPPLCNPEXCEDSREVSTTLNData-Center Interconnection QueueRegulated Utility Load GrowthHyperscaler Power ContractsRate-Base Capex CycleGas Turbine SupplyUtility Equity Dilution
TickerCompanySegmentTrend · 13mo30D1Y
The subject · what this brief is about
AEPAmerican Electric PowerVertically Integrated Utilities🟢 Cont. Bull−9.1%+8.7%
ETREntergyVertically Integrated Utilities🟢 Cont. Bull−6.9%+18.9%
NEENextEra EnergyVertically Integrated Utilities⚠️ Emerging Bear−6.3%+13.4%
Compared against · context, not the story
DDominion EnergyVertically Integrated Utilities🟢 Cont. Bull−5.7%+14.4%
SOThe SouthernVertically Integrated Utilities🟢 Cont. Bull−8.1%−3.0%
DUKDuke EnergyVertically Integrated Utilities🟢 Cont. Bull−7.3%−1.0%
XELXcel EnergyVertically Integrated Utilities🟢 Cont. Bull−5.0%+6.9%
WECWEC EnergyVertically Integrated Utilities🟢 Cont. Bull−6.7%+0.8%
PPLPPLTransmission & Distribution Only⚠️ Emerging Bear−5.4%−3.6%
CNPCenterPoint EnergyUS Electric & Gas Utilities🟢 Cont. Bull−12.1%+4.0%
EXCExelonVertically Integrated Utilities⚠️ Emerging Bear−7.5%−0.1%
EDConsolidated EdisonVertically Integrated Utilities🟢 Cont. Bull−4.6%+9.0%
SRESempraUS Electric & Gas Utilities⚠️ Emerging Bear−8.5%+3.7%
VSTVistraIntegrated Retail & Generation🔴 Cont. Bear−8.4%−28.1%
TLNTalen EnergyWholesale Power Producers🟢 Cont. Bull−3.6%−11.6%

12-month price & trend

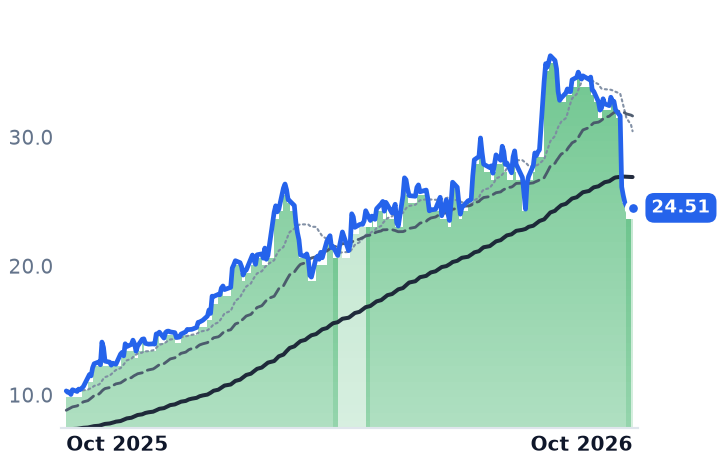
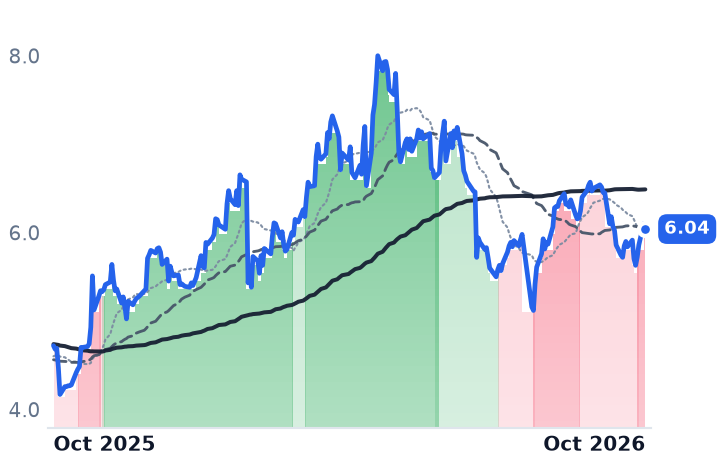
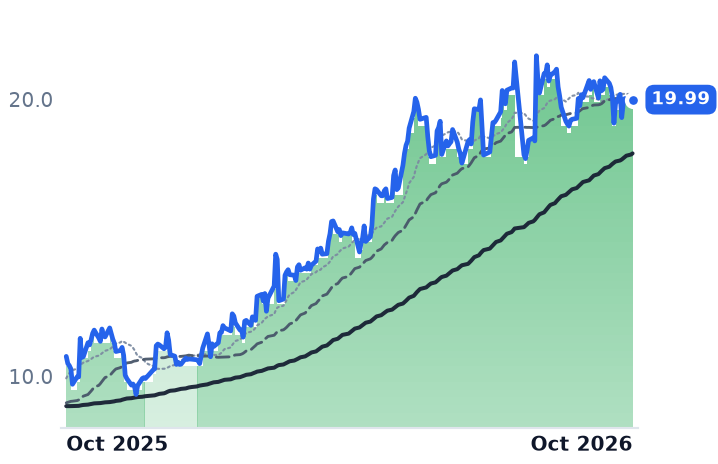
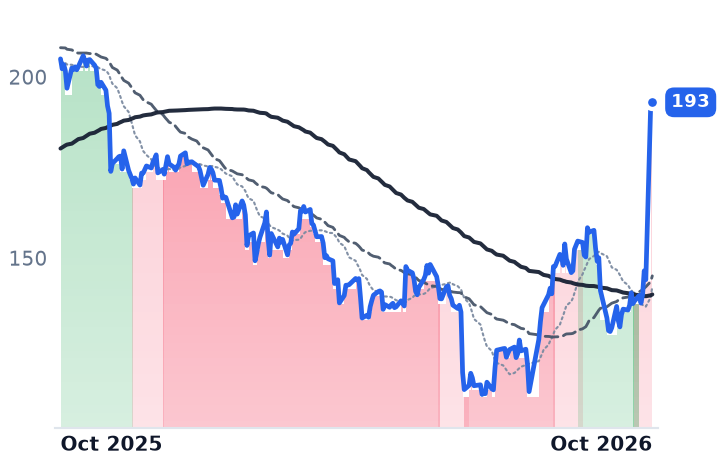
AEP
American Electric Power
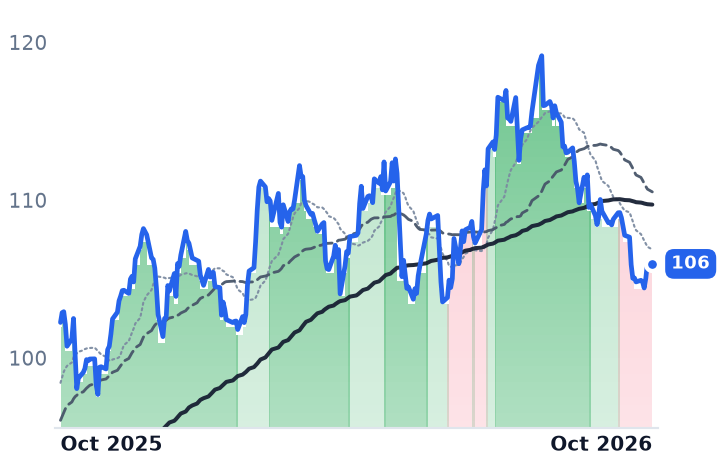
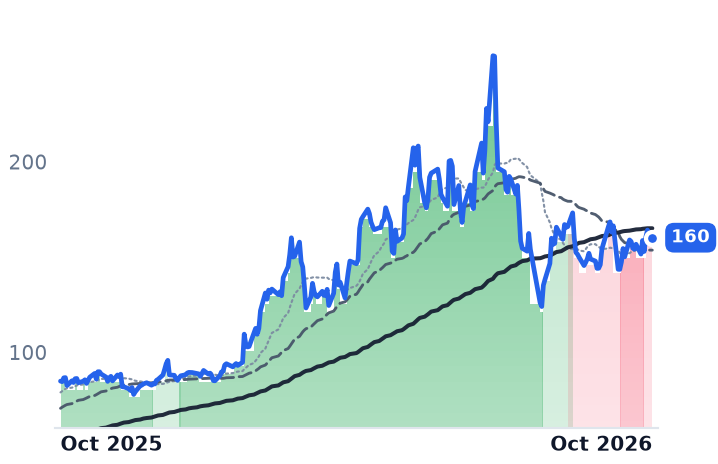
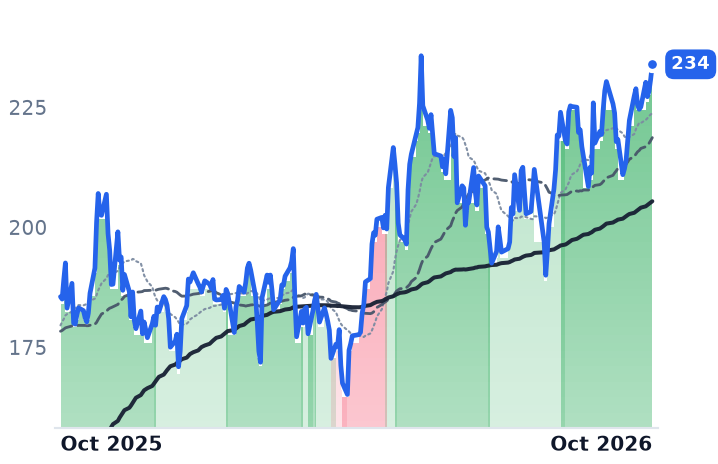
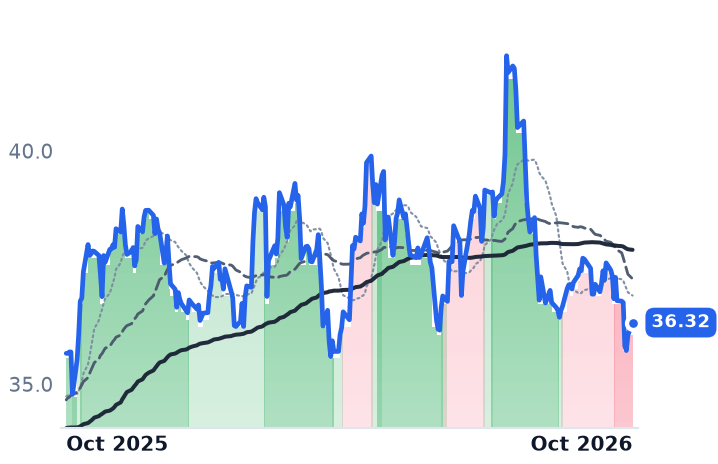
121
−5.11 (−4.05%)
vs. prior close
Price20d50d150d
AEP 12-month price
Vertically Integrated Utilities
ETR
Entergy
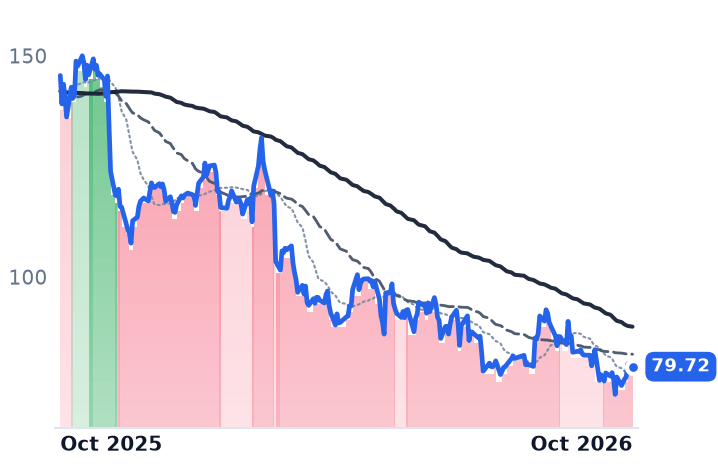
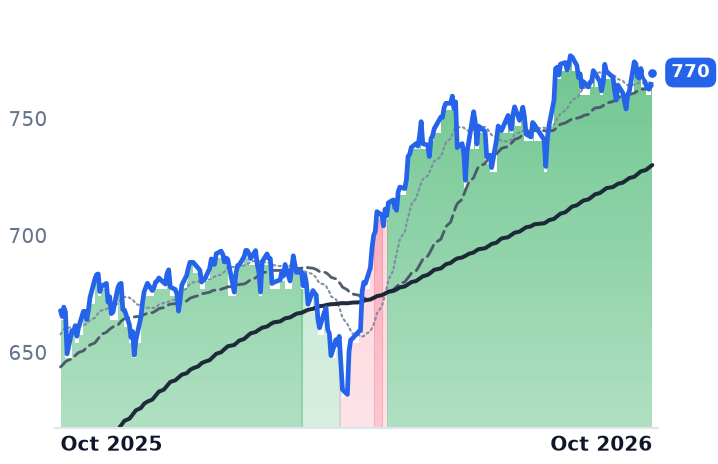
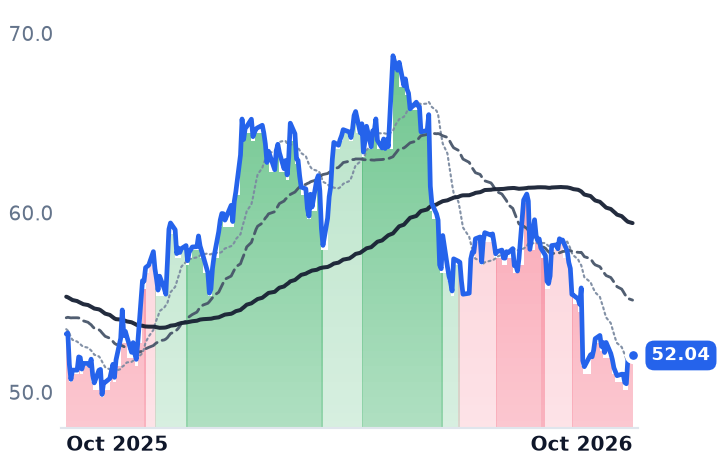
105
−3.00 (−2.79%)
vs. prior close
Price20d50d150d
ETR 12-month price
Vertically Integrated Utilities
NEE
NextEra Energy
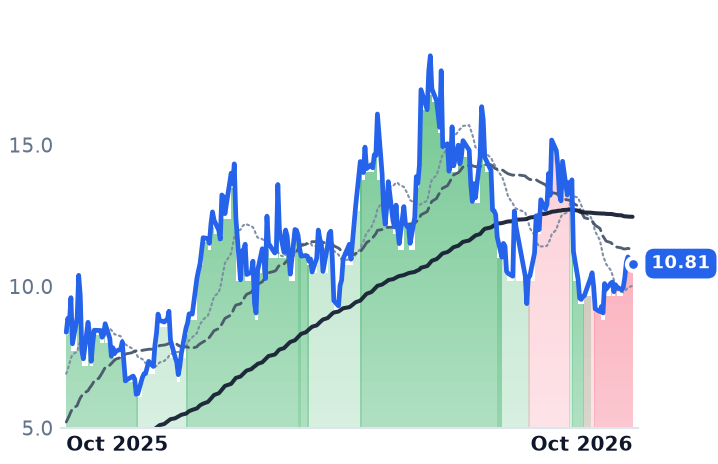
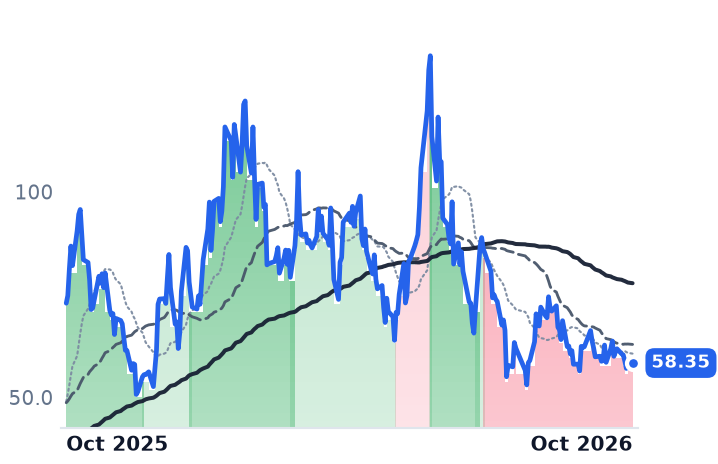
83.65
−1.60 (−1.88%)
vs. prior close
Price20d50d150d
NEE 12-month price
Vertically Integrated Utilities
TickerMkt capP/EP/E fwdP/SP/S fwdP/GPP/GP fwdEV/EBITDAFCF yld
AEP$65.8B20.8x19.0x2.9x2.8x6.0x5.7x13.8x13.6%
ETR$48.8B26.4x23.8x3.6x3.5x9.3x9.0x14.2x-6.4%
NEE$174.5B18.7x20.8x6.0x5.6x8.4x7.8x15.9x-5.8%
D
Dominion Energy
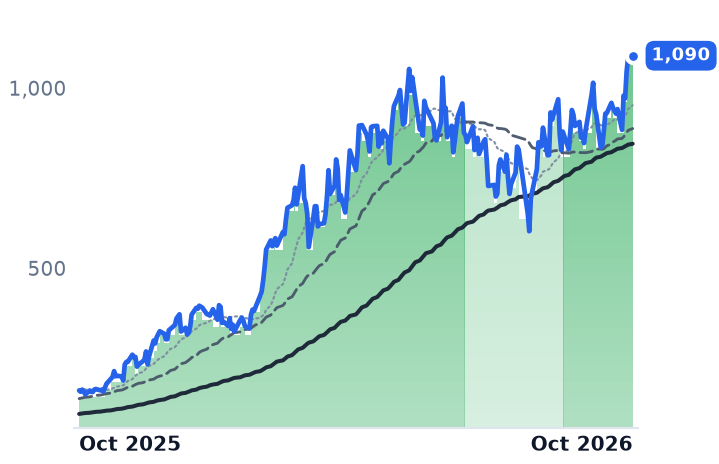
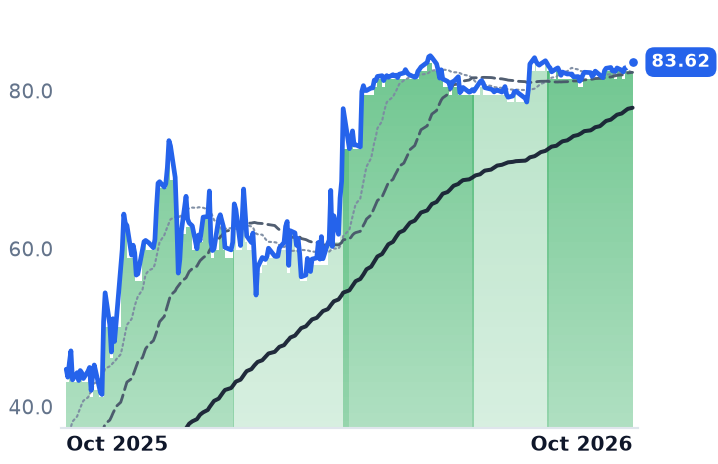
66.60
−1.44 (−2.11%)
vs. prior close
Price20d50d150d
D 12-month price
Vertically Integrated Utilities
SO
The Southern
88.94
−2.71 (−2.96%)
vs. prior close
Price20d50d150d
SO 12-month price
Vertically Integrated Utilities
DUK
Duke Energy
120
−2.84 (−2.31%)
vs. prior close
Price20d50d150d
DUK 12-month price
Vertically Integrated Utilities
TickerMkt capP/EP/E fwdP/SP/S fwdP/GPP/GP fwdEV/EBITDAFCF yld
D$58.6B23.0x18.6x3.2x3.2x6.5x6.5x15.2x-11.7%
SO$106.6B22.2x20.2x3.5x3.5x8.1x8.0x12.7x2.4%
DUK$96.6B18.6x18.5x2.9x2.9x4.2x4.2x11.6x1.6%
XEL
Xcel Energy
76.30
−2.60 (−3.30%)
vs. prior close
Price20d50d150d
XEL 12-month price
Vertically Integrated Utilities
WEC
WEC Energy
106
−2.39 (−2.20%)
vs. prior close
Price20d50d150d
WEC 12-month price
Vertically Integrated Utilities
PPL
PPL
34.38
−0.82 (−2.33%)
vs. prior close
Price20d50d150d
PPL 12-month price
Transmission & Distribution Only
TickerMkt capP/EP/E fwdP/SP/S fwdP/GPP/GP fwdEV/EBITDAFCF yld
XEL$48.6B23.3x19.0x3.3x3.1x17.4x16.2x13.9x-6.7%
WEC$35.6B21.7x19.5x3.5x3.5x6.3x6.3x14.3x-3.1%
PPL$25.9B27.1x17.6x3.6x2.7x10.5x7.7x13.7x1.0%
CNP
CenterPoint Energy
38.77
−1.38 (−3.45%)
vs. prior close
Price20d50d150d
CNP 12-month price
US Electric & Gas Utilities
EXC
Exelon
43.78
−1.35 (−2.98%)
vs. prior close
Price20d50d150d
EXC 12-month price
Vertically Integrated Utilities
ED
Consolidated Edison
106
−2.15 (−1.99%)
vs. prior close
Price20d50d150d
ED 12-month price
Vertically Integrated Utilities
TickerMkt capP/EP/E fwdP/SP/S fwdP/GPP/GP fwdEV/EBITDAFCF yld
CNP$25.5B22.8x20.3x2.7x2.6x4.9x4.8x12.6x-10.6%
EXC$44.4B16.0x15.2x1.8x1.8x7.4x7.3x10.7x-4.9%
ED$38.8B17.7x17.3x2.3x2.2x3.5x3.4x9.4x7.2%
SRE
Sempra
82.89
−4.75 (−5.42%)
vs. prior close
Price20d50d150d
SRE 12-month price
US Electric & Gas Utilities
VST
Vistra
136
−2.73 (−1.96%)
vs. prior close
Price20d50d150d
VST 12-month price
Integrated Retail & Generation
TLN
Talen Energy
314
−2.98 (−0.94%)
vs. prior close
Price20d50d150d
TLN 12-month price
Wholesale Power Producers
TickerMkt capP/EP/E fwdP/SP/S fwdP/GPP/GP fwdEV/EBITDAFCF yld
SRE$54.2B23.9x16.2x4.0x4.0x9.6x9.5x13.9x-10.9%
VST$45.9B22.7x15.4x2.9x2.0x22.2x15.4x10.1x3.0%
TLN$14.3Bn/m14.9x4.0x3.2x9.1x7.1x29.7x3.6%

Consensus projections

TickerFY2026EFY2027EFY2028E
AEPRevenue+9.5%+5.9%+7.6%
EPS+7.9%+7.6%+10.7%
ETRRevenue+8.6%+9.7%+9.6%
EPS+12.3%+15.9%+13.5%
NEERevenue+10.4%+9.9%+8.6%
EPS+9.0%+9.1%+8.3%
DRevenue+13.3%+6.3%+5.7%
EPS+5.0%+6.3%+7.0%
SORevenue+7.7%+5.5%+6.1%
EPS+6.8%+7.5%+9.2%
DUKRevenue+5.8%+4.6%+4.2%
EPS+6.3%+6.9%+7.0%
XELRevenue+7.8%+8.9%+8.1%
EPS+8.0%+10.4%+10.1%
WECRevenue+8.0%+5.0%+7.5%
EPS+6.6%+7.2%+8.2%
PPLRevenue+11.0%+5.8%+5.4%
EPS+7.6%+8.7%+8.4%
CNPRevenue+9.0%+3.9%+5.0%
EPS+8.5%+9.1%+9.2%
EXCRevenue+4.2%+2.7%+3.4%
EPS+5.4%+6.2%+7.2%
EDRevenue+6.9%+4.2%+3.9%
EPS+7.3%+6.2%+6.5%
SRERevenue−3.7%−1.8%+1.7%
EPS+11.6%+8.1%+8.4%
VSTRevenue+19.1%+9.1%+4.6%
EPS+85.1%+18.6%+18.1%
TLNRevenue+85.7%+15.6%+5.1%
EPS+256.0%+51.3%+20.9%

Forward fiscal years only. Blank means no analyst coverage for that year.

On August 3 Texas Governor Greg Abbott directed the Public Utility Commission and ERCOT to verify every data-center project sitting in the state's interconnection queue and to pause new grid connections until the work is done. Four days later the grid operator failed to issue the "Batch Zero" classifications that were due under its own planning guide — the ruling that separates committed projects from speculative ones. American Electric Power, the Columbus-based utility that generates and delivers power across eleven states, had put all 45 gigawatts of its Texas large-load projects into that process, backed by $2bn of cash and credit support from hyperscalers and large industrials.

The queue under audit runs to roughly 474 gigawatts of requests, about 90% of it data centers, and ERCOT aims to finish by December 10. That date now governs the largest single block of load in AEP's capital plan. Utilities that own generation as well as wires — AEP, Entergy and NextEra Energy all do — carry construction and stranded-cost risk that a pure transmission owner does not, which is why the difference between a signed contract and a queue position is the whole argument.

What actually happened to the businesses

AEP raised 2026 operating earnings guidance to $6.25-$6.55 a share from $6.15-$6.45 on its July 30 call, lifted contracted large-load additions through 2030 to 69 gigawatts from 63 the prior quarter, and is running a $78bn five-year capital plan implying an 11% annual rate-base growth rate — roughly double the plan of four years ago. Its chief financial officer said he believes the Texas volumes are "pretty firm" and could at worst slip between batches.

There is harder evidence than a pipeline slide. AEP Ohio's approved data-center tariff requires customers to pay for at least 85% of the energy they say they need each month whether they use it or not. After it took effect, AEP Ohio cut its own large-load forecast from 30 gigawatts to 13. A binding tariff winnows. The company has also locked 13 gigawatts of gas turbines through 2031 with options on ten more — the physical constraint that decides who can actually serve the load. Against that, the diluted share count rose 2.7% year over year, the tax on funding rate base with equity.

Entergy, which serves 3 million customers across Arkansas, Louisiana, Mississippi and Texas and runs about 26,000 megawatts of capacity, is the softer case. June-quarter revenue growth decelerated to 5.9% from 12.0% in the prior quarter, adjusted earnings of $1.03 a share slipped year on year, and full-year guidance was affirmed rather than raised. Its hyperscale pipeline stayed at 7-12 gigawatts. The construction is real — Louisiana regulators approved the generation package for Meta's Richland Parish campus, with plants due in late 2028 and 2029, and fast-tracked a roughly $21bn proposal tied to a second Meta site in April. But the share count rose 4.6%, the heaviest dilution of the three, and trailing free cash flow runs at minus 6.4% of market value. On new nuclear, management said in July it is "not near where we need to be yet" and expects no firm update in 2026 or 2027.

NextEra, whose Florida Power & Light unit serves 5.7m accounts and whose Energy Resources arm is the largest US developer of contracted renewables, had the cleanest quarter: revenue up 12.4%, operating margin of 29.7% against 28.5% a year earlier, a backlog of 35.1 gigawatts, guidance untouched. Its complication is corporate. The all-stock purchase of Dominion Energy requires issuing about 716m shares — close to a quarter of the pro-forma company — with shareholder votes on September 3 and closing not expected before the second half of 2027.

What the price is doing, and what it isn't

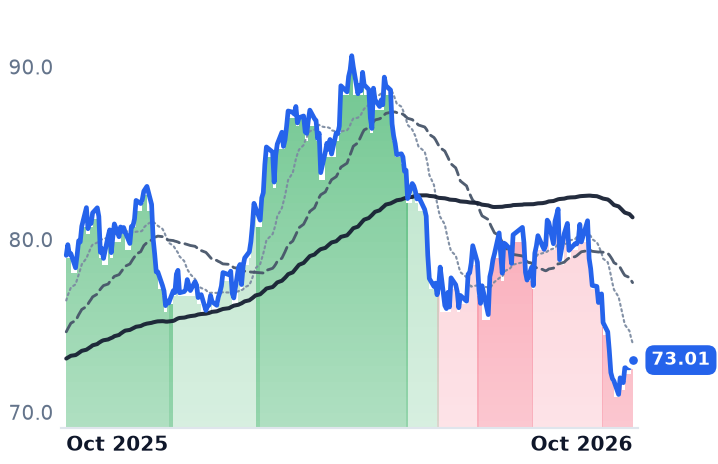
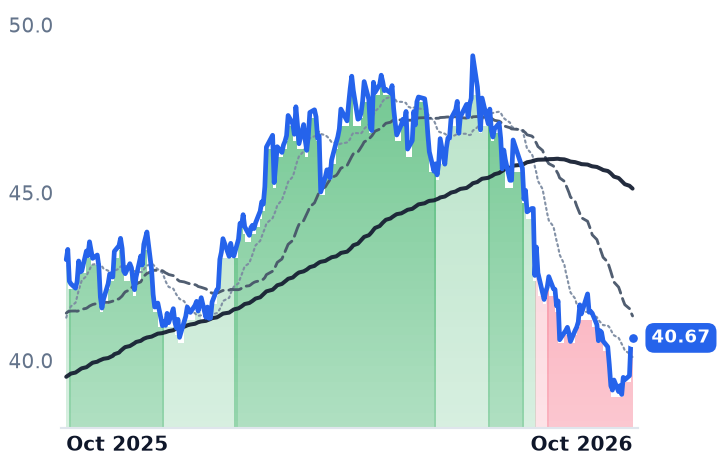
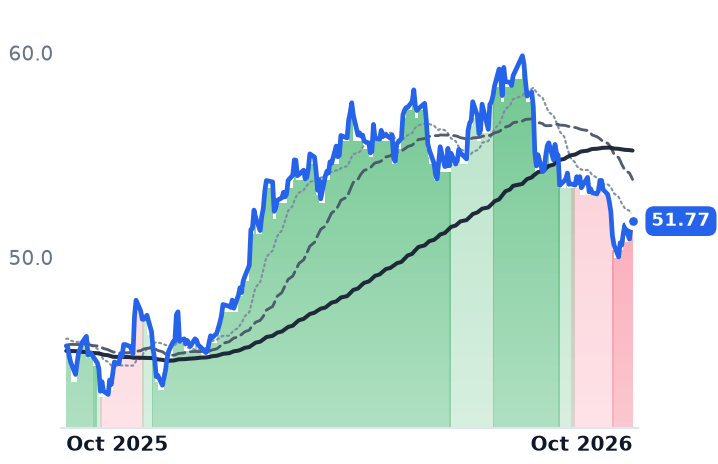
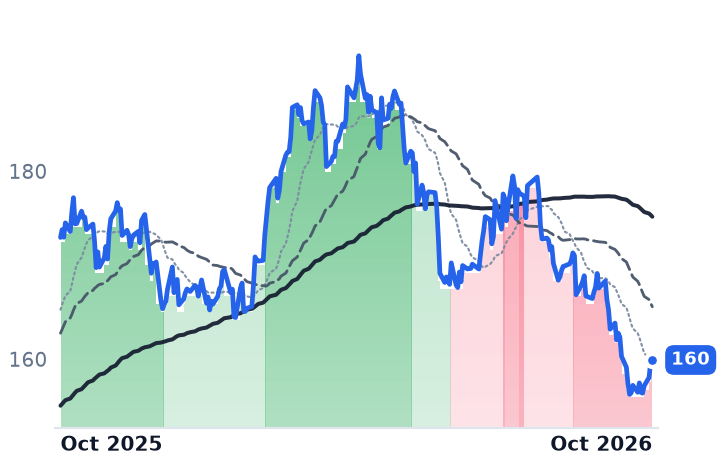
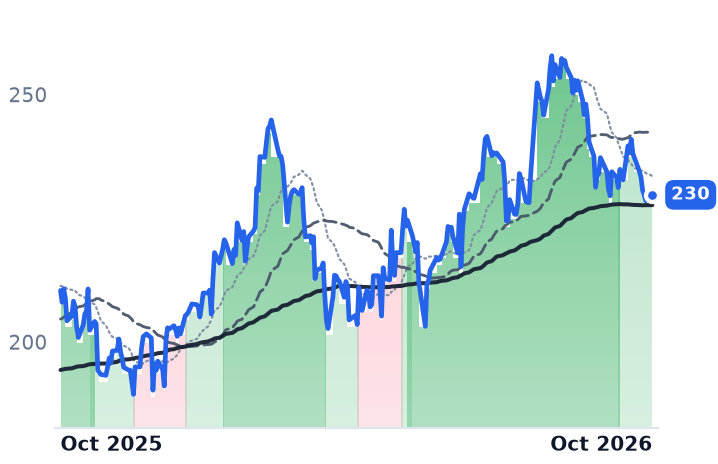
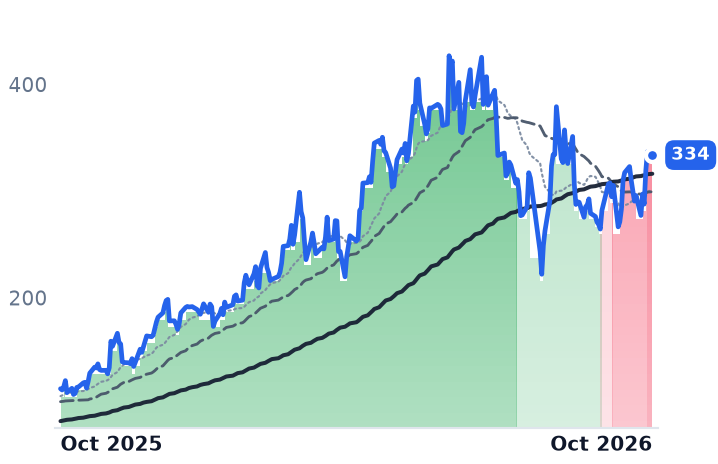
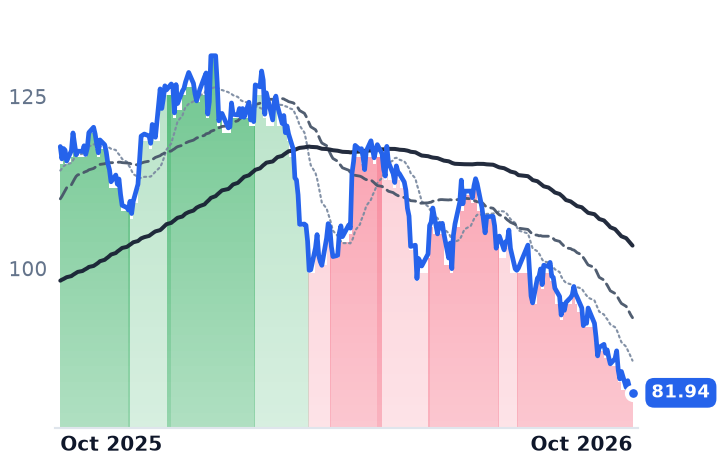
Most of the month's decline is a rate sort. On August 21 every regulated electric name fell together — AEP 4.1%, Southern 3.0%, Entergy 2.8%, NextEra 1.9% — on a session when the S&P 500 rose 0.43%, three days after the 30-year Treasury yield reached a 19-year high above 5.33%, the same long bond against which these long-dated cash flows are discounted. Twelve of twelve regulated names fell over the month.

But the dates do not all line up on the bond. AEP and Entergy both broke months-long uptrends on August 7 — the missed Batch Zero date — before the yield spike. And the multiples now disagree with the disclosures. AEP has compressed to 19.0x forward earnings from 20.9x on its July price, the cheapest of the three, on the only raised guidance and the largest rate-base growth. Entergy, at 23.8x from 26.1x, is still the most expensive on the weakest quarter; that premium rests entirely on consensus growth of 12.3% next year and 15.9% the year after, which the June quarter did not advance. NextEra's move from 22.2x to 20.8x returns it to roughly its own long-run level and says less about artificial-intelligence load than about the equity it is about to print.

So the group fell as one thing and splits into three. Entergy's de-rating is earned. NextEra's is a merger, not a demand story. AEP's is the one the business contradicts — and the contradiction has a resolution date rather than an argument.

If the Texas audit clears AEP's 45 gigawatts, a $78bn plan built partly on 13 gigawatts of assumed Texas load has a very long runway. If it doesn't, the $2bn of hyperscaler collateral is the only part of that number anyone can bank.

Nebius's Customers Prepaid for Half of Its 2026 Data-Center Buildout

Hypothesis Opus 5 · Research Opus 5 · Writing Opus 5 · Prompt v1.6

Two companies renting out AI compute are financing identical steel on opposite terms. Nebius sold convertible notes last week whose largest tranche pays a coupon of half a percent, and its customers put cash down on 70% of the deals it closed in the June quarter — management expects more than $9bn of prepayments this year against a capex program guided at $20-25bn. Applied Digital borrows at 9.250% on secured notes and bills its tenants for construction.

The revenue quality differs as much as the funding. Nebius's run-rate revenue reached $3.0bn, up 598%. Applied Digital's May quarter looked like a doubling, but $152.4m of it was tenant fit-out work and only $44.1m was base rent — the reason gross margin fell from 42% to 16%. Nebius's shares are flat over three months and its multiple has compressed by a third; Applied Digital's 41% decline did almost no valuation work.

NBISAPLDCRWVGDSVNETNeocloud Compute RentalAI Data-Center BuildoutCapex Financing StructuresGPU Depreciation SchedulesContracted Lease BacklogAI Credit Spreads
TickerCompanySegmentTrend · 13mo30D1Y
The subject · what this brief is about
NBISNebiusCloud Infrastructure & AI🟢 Cont. Bull+29.1%+213.0%
APLDApplied DigitalData Center & Cloud Infrastructure⚠️ Emerging Bear+2.2%+70.6%
Compared against · context, not the story
CRWVCoreWeaveCloud GPU Computing🔴 Cont. Bear+30.5%−4.9%
GDSGDSData Center & Cloud Infrastructure⚠️ Emerging Bear+7.3%−1.1%
VNETVNETData Center & Cloud Infrastructure⚠️ Emerging Bear−0.4%−14.3%

12-month price & trend

NBIS
Nebius
219
+1.85 (+0.85%)
vs. prior close
Price20d50d150d
NBIS 12-month price
Cloud Infrastructure & AI
APLD
Applied Digital
27.21
−1.44 (−5.03%)
vs. prior close
Price20d50d150d
APLD 12-month price
Data Center & Cloud Infrastructure
CRWV
CoreWeave
87.85
−1.38 (−1.55%)
vs. prior close
Price20d50d150d
CRWV 12-month price
Cloud GPU Computing
TickerMkt capP/EP/E fwdP/SP/S fwdP/GPP/GP fwdEV/EBITDAFCF yld
NBIS$52.6B842.8x38.8x15.7x66.2x26.8x57.1x-11.2%
APLD$7.8Bn/m13.6x9.6x60.7x42.7xn/m-35.4%
CRWV$47.9Bn/m6.3x3.7x9.4x5.5x36.5x-28.5%
GDS
GDS
32.85
+0.00 (+0.00%)
vs. prior close
Price20d50d150d
GDS 12-month price
Data Center & Cloud Infrastructure
VNET
VNET
6.72
+0.07 (+1.05%)
vs. prior close
Price20d50d150d
VNET 12-month price
Data Center & Cloud Infrastructure
TickerMkt capP/EP/E fwdP/SP/S fwdP/GPP/GP fwdEV/EBITDAFCF yld
GDS$6.4B12.2x3.6x14.9x14.0x-1.8%
VNET$1.9Bn/m1.2x5.8x9.7x-58.1%

Consensus projections

TickerFY2026EFY2027EFY2028E
NBISRevenue+507.8%+255.9%+85.7%
EPS+68.3%+54.1%−116.9%
APLDRevenue+98.7%+92.0%+149.5%
EPS−24.3%+9.0%−74.8%
CRWVRevenue+152.1%+105.4%+58.6%
EPS+199.3%−54.1%−134.7%
GDSRevenue+12.6%+10.4%+24.4%
EPS−33.0%−82.7%+60.1%
VNETRevenue+20.5%+22.0%+20.8%
EPS−32.3%−239.3%+74.3%

Forward fiscal years only. Blank means no analyst coverage for that year.

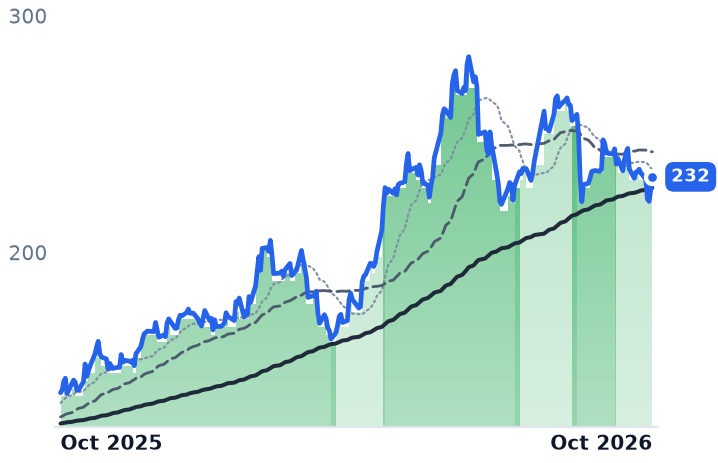
Nebius priced $5.0bn of convertible notes on 20 August, and the cash settles Monday. The larger tranche, $3.0bn due 2030, pays a coupon of 0.50%; the $2.0bn due 2034 pays 4.50%, with conversion prices set 40% and 45% above the prior close. It is the cheapest money anyone on this rung of the artificial-intelligence buildout has raised this year, and it is not even the cheapest money Nebius has.

That distinction belongs to its customers. Seventy percent of the deals the Amsterdam-based cloud operator — formerly Yandex N.V. — closed in the June quarter carried an upfront payment, and it expects more than $9bn of such prepayments in 2026, covering 50-60% of a capital program guided at $20-25bn. Compare Applied Digital, the Dallas developer that builds and leases AI data centers and was called Applied Blockchain until 2022: its subsidiary sold $2.35bn of senior secured notes at 9.250%, issued at 97, with amortization starting December 2027. Both companies are pouring concrete for the same tenants. One is being paid to do it; the other is paying to.

What each company calls revenue

Nebius's June-quarter revenue was $582.3m, up 454%, and annualized run-rate revenue hit $3.0bn, up 598% and 58% sequentially. Four deals signed in the quarter each carried more than $1bn of annual contract value — with Reflection, Cohere, an unnamed scaled U.S. AI lab and a large quantitative trading firm — priced at $20-25m per megawatt. Adjusted earnings before interest, taxes, depreciation and amortization reached $236m, a 41% margin. The number that margin excludes is the story: $260m of hardware depreciation in the same three months, more than the adjusted profit it is added back to. Reported operating income was minus $175.9m. Nebius depreciates its accelerators over four years, against six at CoreWeave — a harsher schedule, and one reason the reported loss is as large as it is.

Applied Digital's May quarter looked like a doubling and was mostly a construction bill. Of $258.7m in revenue, the hosting business produced $203m — but $152.4m of that was tenant fit-out services against $44.1m of base rent and $6.5m of recoveries. Gross margin fell from 42% in February to 16%, and the operating loss widened to $117.0m. Strip the pass-through out and the recurring business is small but excellent: net operating income of $39.9m at a 91% margin. The legacy crypto-hosting segment, at $37.3m, is no longer the problem anyone should be watching.

The scale of what has been signed is not in question. Applied Digital has 1.4 gigawatts of contracted load representing roughly $36bn of total lease revenue, about $20bn of it added in the May quarter alone — 4.6 times its market value. It is recognizing base rent at roughly $176m a year, half a percent of the total. Nebius's committed backlog exceeds $40bn, three-quarters of its market value, and it is already converting it at a $3.0bn run rate.

The shares, and what they absorbed

Nebius is up 2% over three months and sits 23.6% below its 18 June high, having given back most of a 29.8% jump on the day of its results. Applied Digital is down 41%. Both fell together on 29 July when credit-default-swap costs on AI cloud borrowers widened and again on 18 August, when the 30-year Treasury yield reached a 19-year high — the same session that has been pressuring every leveraged landlord in the market.

What the two moves accomplished differs entirely. Nebius now trades at 66x trailing gross profit against 98x in early May, while its market value rose from $35.7bn to $52.6bn; the earnings absorbed the whole re-rating, and the forward figure is 27x. Applied Digital's 41% fall took its multiple from 63x to 61x — a de-rating in price that did almost nothing to valuation, with 43x on forward estimates. CoreWeave, the largest comparable operator, trades at 9x trailing gross profit, because its revenue base is already recognized rather than contracted.

The verdict

Nebius's flat shares are not a business problem; every disclosed line accelerated, and the market simply refused to pay more for it. Its risk is arithmetic, not demand: depreciation already exceeds the profit measure management leads with, so the margin case rests on the accelerators earning for four years. Chief financial officer Dado Alonso told investors on 12 August that the company has "visibility into pricing and expect capacity coming online from our own data center to begin improving margins in the second half of next year." Chief executive Arkady Volozh was blunter about the demand side: "We could sell today our entire 2027 capacity on these terms if we wanted to. But we are not doing this."

Applied Digital's decline is better earned. Its growth is real, its tenants are investment-grade, and its rent carries a 91% operating margin — but the revenue it is booking today is construction, its cash burn is the deepest of the three names relative to market value, and it services 9.250% paper through every quarter before the rent starts. Chief executive Wes Cummins called the model "a disciplined, repeatable AI Factory" when announcing a second 300 MW hyperscaler lease in May. Repeatable it may be; self-funding it is not.

Nebius has arranged matters so that the people who want the compute pay first. Applied Digital pays its lenders first and collects rent later. Which model survives depends less on how much AI demand arrives than on how long an accelerator stays worth renting — four years, on Nebius's own books.

Arista Lost the Ethernet Switching Lead to Nvidia While Raising Guidance to $12.6bn

Hypothesis Opus 5 · Research Opus 5 · Writing Opus 5 · Prompt v1.6

Arista's business is accelerating and its market is accelerating faster. Data-center Ethernet switching grew 39.8% year over year to $15.4bn in the March quarter, per IDC; Arista's revenue grew 37.3% in the same period, and Nvidia — which sells switching bundled with accelerators — took the number-one revenue spot with 21.5% share against Arista's 20.7%.

The fundamentals are not deteriorating. Arista's revenue growth has accelerated four quarters running to 37.7%, guidance has been raised three times to roughly $12.6bn, and multiyear purchase commitments tripled to $9.7bn. But gross margin fell 232 basis points on customer mix, and management says pricing power does not arrive until 2027.

Cisco is the counter-case: $9.3bn of hyperscaler AI orders in fiscal 2026, only about $4bn recognized as revenue, and roughly 40% of the headline is optics rather than switches.

ANETCSCOHPEEXTRNVDAAVGOSPYData-Center Ethernet SwitchingAI Back-End FabricsHyperscaler CapexMerchant Switch SiliconOptics & ConnectivityHardware Margin Mix
TickerCompanySegmentTrend · 13mo30D1Y
The subject · what this brief is about
ANETArista NetworksCloud Networking🟢 Cont. Bull+11.2%+41.8%
CSCOCisco SystemsEnterprise Networking Infrastructure🟢 Cont. Bull−3.9%+68.2%
Compared against · context, not the story
HPEHewlett Packard EnterpriseEnterprise Storage & Software🟢 Cont. Bull+17.2%+141.2%
EXTRExtreme NetworksEnterprise Networking Infrastructure🌱 Emerging Bull−23.2%+11.3%
NVDANVIDIAAI & Data Center GPUs🟢 Cont. Bull+9.0%+19.4%
AVGOBroadcomSemiconductor Subsystems🟢 Cont. Bull−3.3%+25.9%
SPYState Street SPDR S&P 500 ETF TrustAsset Management🟢 Cont. Bull+3.4%+20.2%

12-month price & trend

ANET
Arista Networks
189
+4.01 (+2.17%)
vs. prior close
Price20d50d150d
ANET 12-month price
Cloud Networking
CSCO
Cisco Systems
111
+1.45 (+1.32%)
vs. prior close
Price20d50d150d
CSCO 12-month price
Enterprise Networking Infrastructure
HPE
Hewlett Packard Enterprise
53.45
+0.56 (+1.06%)
vs. prior close
Price20d50d150d
HPE 12-month price
Enterprise Storage & Software
TickerMkt capP/EP/E fwdP/SP/S fwdP/GPP/GP fwdEV/EBITDAFCF yld
ANET$237.5B58.8x45.9x22.5x18.7x35.8x29.8x46.1x2.2%
CSCO$437.7B33.0x21.6x6.9x6.0x10.7x9.3x23.0x3.1%
HPE$70.8B49.0x15.6x1.8x1.6x5.5x4.8x21.6x5.6%
EXTR
Extreme Networks
23.02
+0.58 (+2.56%)
vs. prior close
Price20d50d150d
EXTR 12-month price
Enterprise Networking Infrastructure
NVDA
NVIDIA
215
−2.13 (−0.98%)
vs. prior close
Price20d50d150d
NVDA 12-month price
AI & Data Center GPUs
AVGO
Broadcom
368
+4.42 (+1.21%)
vs. prior close
Price20d50d150d
AVGO 12-month price
Semiconductor Subsystems
TickerMkt capP/EP/E fwdP/SP/S fwdP/GPP/GP fwdEV/EBITDAFCF yld
EXTR$3.1B75.0x18.4x2.5x2.3x4.0x3.7x39.1x1.9%
NVDA$5.5T34.3x25.0x21.5x13.9x29.0x18.7x28.3x2.2%
AVGO$1.8T59.5x31.8x23.2x16.6x34.7x24.8x42.8x1.9%
SPY
State Street SPDR S&P 500 ETF Trust
766
+2.42 (+0.32%)
vs. prior close
Price20d50d150d
SPY 12-month price
Asset Management
TickerMkt capP/EP/E fwdP/SP/S fwdP/GPP/GP fwdEV/EBITDAFCF yld
SPY$773.0B

Consensus projections

TickerFY2026EFY2027EFY2028E
ANETRevenue+42.4%+30.0%+23.9%
EPS+42.4%+27.2%+22.5%
CSCORevenue+11.1%+16.2%+7.1%
EPS+12.9%+20.0%+9.3%
HPERevenue+30.3%+11.5%+5.6%
EPS+80.5%+18.1%+9.6%
EXTRRevenue+12.8%+9.2%+9.2%
EPS+26.5%+26.4%+16.4%
NVDARevenue+65.1%+84.2%+43.2%
EPS+59.0%+91.7%+42.0%
AVGORevenue+66.8%+66.1%+34.5%
EPS+71.8%+68.7%+34.8%

Forward fiscal years only. Blank means no analyst coverage for that year.

The company that sells the most Ethernet switching into data centers does not sell switches for a living. Nvidia booked $2.1bn of data-center Ethernet switch revenue in the March quarter, 21.5% of the market against Arista Networks' 20.7%, taking the top revenue position in a category Arista has defined for a decade.

It took it by not selling switching as such. Nvidia's Spectrum-X ships inside an integrated package of GPUs, switches, data-processing units and cables, which is how an accelerator vendor captures the network content that used to be bid separately. Below Arista, Broadcom is shipping Tomahawk 6, a 102.4-terabit single-chip switch supporting up to 512 ports at 200 gigabits, positioned explicitly to give hyperscalers an open fabric without proprietary lock-in. The pool being fought over is large: Dell'Oro Group expects data-center switch sales into artificial-intelligence back-end networks to exceed $100bn by 2030, roughly $80bn of it over the next five years.

The business is not the problem

Arista, which sells high-performance Ethernet switches and routers running its own operating system to cloud, telecom and financial customers, has accelerated for four straight quarters — from 27.5% year-over-year revenue growth to 37.7% in the June quarter, its first $3bn quarter at $3.036bn. On the August 4 call it raised 2026 guidance for the third time, to about $12.6bn, $2.1bn above the original Analyst Day target of $10.5bn. Its Etherlink AI fabric switches now exceed 100 cumulative customers, up from four or five in 2024, and the company targets at least $3.5bn of AI-fabric revenue this year. Multiyear purchase commitments tripled to $9.7bn from $3.6bn, and deferred revenue reached $6.9bn.

What that growth costs shows up one line down. Gross margin fell 232 basis points year over year to 62.9%, inside a 62-64% guide, as hyperscale mix diluted it; operating margin still rose, to 45.4%, because operating income grew 39.7% against revenue's 37.7%. Management says the pricing power to offset mix does not exist yet — backlog is still shipping at prior prices, with structural pricing power pushed to 2027. On the white-box threat, chairperson and chief executive Jayshree Ullal was dismissive: "White box is certainly a tactical solution that we tend to see more in use cases that are simple, scale-up or scale-out where the actual amount of software and system requirements are low," she told investors. Microsoft and Meta were 26% and 16% of 2025 revenue.

Cisco's number is orders, and 40% of it is optics

Cisco booked $9.3bn of hyperscaler AI infrastructure orders in fiscal 2026, about 4.5 times the prior year — but roughly 60% was Silicon One-based systems and 40% Acacia optics, putting switching content nearer $5.6bn. It recognized about $4bn as revenue and guides $7.5bn for fiscal 2027. The same mix that produced the orders erodes the margin: "You should expect a slight gross margin headwind as we move through FY 2027 as we address these very high growth opportunities," chief financial officer Mark Patterson said on the August 12 call.

What the shares earned

Arista's price per dollar of trailing gross profit has moved from roughly 32.5x a year ago to 35.8x while those gross-profit dollars grew 30% — most of its 42.9% twelve-month gain was paid for by profit. Cisco's went from about 7.2x to 10.7x on 11.1% gross-profit growth, so most of its 65.7% year is re-rating, and it now trades at 21.6x forward earnings against roughly 18x in May at a higher share price. The networking group's roughly 11% fall between August 12 and 20, against a 1.2% dip in the S&P 500 tracker and the 30-year Treasury yield's touch of 5.32%, was a de-risking of the whole AI-infrastructure complex rather than a verdict on switching.

The finding is narrower and harder than the drawdown. Arista is compounding, and losing relative ground anyway, because the switching dollar is increasingly sold by whoever sells the accelerator. Ullal's pricing power arrives in 2027, when the old backlog clears and 1.6-terabit Etherlink reaches production. That is also two more years for a bundled fabric to become the default that nobody has to bid.

NRG Planned on $52 Texas Power and Got $33 While Vistra Sold Meta 2,600 MW of Nuclear

Hypothesis Opus 5 · Research Opus 5 · Writing Opus 5 · Prompt v1.6

The two largest merchant power producers in Texas have lost roughly a quarter of their market value in a year, and only one of them can point to a business that deteriorated. NRG's Texas earnings fell $131m in the second quarter because ERCOT wholesale prices came in far under its own planning assumption, and its adjusted earnings per share dropped to $1.49 from $1.73. Vistra's adjusted EBITDA rose about 30% to $1.77bn over the same quarter, it has hedged essentially all of its 2026 output, and it holds signed 20-year nuclear contracts with Meta plus a separate 1,200 MW deal at Comanche Peak. What is deflating is the price of a megawatt-hour — batteries and cheaper gas — not the demand for megawatts. NRG's de-rating to 12.7x forward earnings is earned; Vistra at 15.4x is harder to square with what it has disclosed.

VSTNRGCEGTLNPEGERCOT Wholesale PricesBattery Storage BuildoutMerchant Generation HedgingNuclear Data-Center PPAsPJM Capacity MarketRetail Electricity Margins
TickerCompanySegmentTrend · 13mo30D1Y
The subject · what this brief is about
VSTVistraIntegrated Retail & Generation🔴 Cont. Bear−8.4%−28.1%
NRGNRG EnergyIntegrated Retail & Generation⚠️ Emerging Bear−11.3%−21.4%
Compared against · context, not the story
CEGConstellation EnergyDiversified Renewable Generators⚠️ Emerging Bear+5.0%−11.9%
TLNTalen EnergyWholesale Power Producers🟢 Cont. Bull−3.6%−11.6%
PEGPublic Service Enterprise Group IncorporatedVertically Integrated Utilities⚠️ Emerging Bear−8.0%−10.0%

12-month price & trend

VST
Vistra
136
−2.73 (−1.96%)
vs. prior close
Price20d50d150d
VST 12-month price
Integrated Retail & Generation
NRG
NRG Energy
113
−2.09 (−1.81%)
vs. prior close
Price20d50d150d
NRG 12-month price
Integrated Retail & Generation
CEG
Constellation Energy
273
−0.04 (−0.01%)
vs. prior close
Price20d50d150d
CEG 12-month price
Diversified Renewable Generators
TickerMkt capP/EP/E fwdP/SP/S fwdP/GPP/GP fwdEV/EBITDAFCF yld
VST$45.9B22.7x15.4x2.9x2.0x22.2x15.4x10.1x3.0%
NRG$23.9B29.6x12.7x0.6x0.7x4.0x4.0x11.2x1.5%
CEG$101.4B27.5x24.1x3.2x3.1x3.4x3.2x14.7x0.3%
TLN
Talen Energy
314
−2.98 (−0.94%)
vs. prior close
Price20d50d150d
TLN 12-month price
Wholesale Power Producers
PEG
Public Service Enterprise Group Incorporated
72.61
−2.14 (−2.86%)
vs. prior close
Price20d50d150d
PEG 12-month price
Vertically Integrated Utilities
TickerMkt capP/EP/E fwdP/SP/S fwdP/GPP/GP fwdEV/EBITDAFCF yld
TLN$14.3Bn/m14.9x4.0x3.2x9.1x7.1x29.7x3.6%
PEG$37.7B18.7x17.3x3.0x3.0x3.5x3.5x14.2x5.3%

Consensus projections

TickerFY2026EFY2027EFY2028E
VSTRevenue+19.1%+9.1%+4.6%
EPS+85.1%+18.6%+18.1%
NRGRevenue+20.5%+1.8%+4.9%
EPS+14.6%+24.0%+16.0%
CEGRevenue+35.3%+4.1%+5.2%
EPS+25.2%+13.1%+28.6%
TLNRevenue+85.7%+15.6%+5.1%
EPS+256.0%+51.3%+20.9%
PEGRevenue+6.5%+3.5%+4.9%
EPS+8.1%+7.0%+7.7%

Forward fiscal years only. Blank means no analyst coverage for that year.

The wholesale price of electricity around the clock in Houston averaged $33 a megawatt-hour in the second quarter, about 8% below a year earlier. NRG Energy — which sells power to some six million retail customers under the Reliant, Green Mountain and Direct Energy brands and owns the generation behind them — had built its year on an assumption of $52. Its Texas adjusted earnings before interest, tax, depreciation and amortization fell $131m, adjusted earnings per share came in at $1.49 against $1.73, and the shares fell 15.5% in the single session of August 4, the day it reported.

That is the central fact of the merchant power complex this summer, and it is easy to mistake for something else. Demand from data centers is not what is deflating. The price of the megawatt-hour is. For the unregulated producers that own the plants a data center actually burns — the layer whose revenue is a direct function of the AI load story — the two are not the same thing at all.

Batteries arrived before the data centers did

In Texas the compression is physical. Roughly 41.5 GW of solar and storage is expected online across 2026 and 2027, and battery price spreads fell about 50% year on year by June, flattening precisely the intraday spikes a merchant gas plant exists to monetize. Vistra's management put a number on it: on July 22 the ERCOT real-time market cleared at $57/MWh in tight conditions where, absent battery competition, it suggests $400 to $500 was plausible. Fuel is falling too — the Energy Information Administration's August outlook cut Henry Hub gas to $3.44 per million British thermal units for 2026 and $3.31 for 2027, and gas sets the marginal power price in nearly every US market.

The one auction print that exists cuts the other way. PJM's capacity auction, announced July 14, cleared at $325 per megawatt-day across the whole footprint, 2.5% under last year's $333.44. But it cleared at the approved cap while falling 6,831 MW short of PJM's own reliability requirement — an administrative ceiling rather than slack demand. ERCOT, an energy-only market, holds no capacity auction at all.

One of these two disclosed a worse business

NRG did. Its second-quarter adjusted EBITDA rose 34% to $1.2bn, but that is acquisition arithmetic — the first full quarter of the LS Power fleet added $370m in the East, alongside the interest and depreciation that pulled per-share earnings down, plus a $70m cost drag from Virginia's unexpected July 1 re-entry into a regional carbon program. Its guidance splits Texas economic gross margin at $4.3bn to $4.55bn, roughly half of it consumer retail rather than wholesale generation. The headline 1.2 GW hyperscaler plant is aligned commercial terms pending a final investment decision, not contracted load. "We will not trade discipline for scale," chief executive Robert Gaudette told analysts on August 4. "Each project must stand on its own."

Vistra disclosed the opposite. Adjusted EBITDA rose about 30% to $1.77bn on realized prices roughly 5% higher and more PJM capacity revenue; full-year guidance of $6.8bn to $7.6bn was reaffirmed. It has hedged approximately 100% of expected 2026 generation, 94% of 2027 and 72% of 2028 — which is why falling Texas power did not dent the quarter, and why a recovery would not lift it much either. It holds 20-year contracts supplying Meta with more than 2,600 MW of PJM nuclear output, a separate 20-year, 1,200 MW agreement at Comanche Peak in Texas, and August regulatory approval for Cogentrix, ten gas plants totaling 5,500 MW for a net $4.0bn. Its 2027 opportunity range of $7.4bn to $7.8bn excludes both Cogentrix and Meta, which management calls roughly $700m additive — while saying the range itself now trends to the low end on ERCOT forwards.

What the shares did, and what it buys

Vistra is down 28.4% over twelve months and NRG 22.5%; since August 4 both have traded with their 50-day average below their 200-day. Constellation, Talen and PSEG each fell roughly 13% over the same year, so this is name-specific rather than a rates story. Vistra sits at 15.4x forward earnings against 22.7x trailing and about 10x trailing EV/EBITDA; NRG at 12.7x forward against 29.6x trailing is now the cheapest name in the complex.

The honest split: NRG's de-rating is earned, because its Texas margin actually shrank and its growth is capital not yet committed. Vistra's is not explained by anything it has disclosed — an EBITDA line up 30%, a hedge book that removes the downside it is being marked for, and contracted nuclear the guidance range does not include. What the market appears to be pricing is the 2027 drift toward the low end and the possibility that Texas power stays where it is. The hedges cut both ways: they are why the second quarter held, and why a price recovery reaches shareholders slowly.

On August 3, Texas Governor Greg Abbott ordered an audit of every data center in ERCOT's interconnection queue — some 474 GW of requests, about 90% of them data centers — with the work due by December 10. Vistra supports the cleanup and puts realistic 2030 large-load additions at 12 to 15 GW. Chief executive Jim Burke expects the audit to "pause some of the reviews for a couple of months". Until December, the number of megawatts Texas will actually connect is a matter for the auditors.

Wednesday's Synopsys Print Tests Whether Ansys Pays: Design IP Fell 6% Last Quarter

Hypothesis Opus 5 · Research Opus 5 · Writing Opus 5 · Prompt v1.6

The two companies whose software every AI accelerator is designed in have split, and only one of the splits is earned. Synopsys reports Wednesday after the close — the first scheduled catalyst either name has since late July — and the line to watch is not revenue, which the Ansys acquisition has inflated by design.

Last quarter Synopsys grew sales 41.9% while gross margin fell nearly eight percentage points to 72.3% and the chip-IP segment shrank 6% year on year. Cadence, meanwhile, accelerated to 24.2% growth on a record $8.1bn backlog and held an 84.9% gross margin — and its shares are lower than a year ago. Synopsys's discount looks paid for; Cadence's does not.

SNPSCDNSTEAMFIGEDA Software DuopolySemiconductor IP LicensingSimulation & Verification ToolsAcquisition Margin DilutionAI Accelerator Design
TickerCompanySegmentTrend · 13mo30D1Y
The subject · what this brief is about
SNPSSynopsysEDA & Design Tools🔴 Cont. Bear+3.7%−34.4%
CDNSCadence Design SystemsDeveloper Tools & DevOps🌱 Emerging Bull−7.5%−8.8%
Compared against · context, not the story
TEAMAtlassianDeveloper Tools & DevOps🔴 Cont. Bear+71.8%+0.6%
FIGFigmaDesign & Content Creation🔴 Cont. Bear+35.5%−64.9%

12-month price & trend

SNPS
Synopsys
398
−0.05 (−0.01%)
vs. prior close
Price20d50d150d
SNPS 12-month price
EDA & Design Tools
CDNS
Cadence Design Systems
319
+5.43 (+1.73%)
vs. prior close
Price20d50d150d
CDNS 12-month price
Developer Tools & DevOps
TEAM
Atlassian
172
−3.10 (−1.77%)
vs. prior close
Price20d50d150d
TEAM 12-month price
Developer Tools & DevOps
TickerMkt capP/EP/E fwdP/SP/S fwdP/GPP/GP fwdEV/EBITDAFCF yld
SNPS$76.2B90.0x26.9x8.8x7.9x11.9x10.7x31.2x3.5%
CDNS$87.9B63.0x39.2x15.0x13.9x17.0x15.7x40.7x1.9%
TEAM$45.1Bn/m31.3x6.9x6.0x8.1x7.1x298.8x2.9%
FIG
Figma
27.10
−0.21 (−0.77%)
vs. prior close
Price20d50d150d
FIG 12-month price
Design & Content Creation
TickerMkt capP/EP/E fwdP/SP/S fwdP/GPP/GP fwdEV/EBITDAFCF yld
FIG$13.2Bn/m94.6x10.3x9.0x13.0x11.4xn/m1.7%

Consensus projections

TickerFY2026EFY2027EFY2028E
SNPSRevenue+37.4%+10.9%+11.9%
EPS+15.2%+17.0%+18.6%
CDNSRevenue+19.7%+13.6%+11.7%
EPS+15.3%+17.0%+14.3%
TEAMRevenue+24.7%+15.4%+14.7%
EPS+55.5%−0.1%+21.6%
FIGRevenue+40.5%+23.8%+24.1%
EPS−24.4%+26.7%+34.5%

Forward fiscal years only. Blank means no analyst coverage for that year.

Synopsys reports third-quarter results on Wednesday after the close, and the question is narrower than its revenue line suggests. The company that sells chip designers their software, their pre-built circuit blocks and their verification hardware bought Ansys, a simulation-software maker, and the deal has been adding revenue faster than it adds profit. Wednesday is the first scheduled test of whether that reverses.

The money at issue is visible in the gap between what Synopsys earns now and what it is expected to earn. The stock changes hands at 90 times trailing earnings and 27 times forward — a compression that is not optimism about growth so much as an assumption that purchase-accounting and integration charges wash out. Nothing in the last print confirmed it yet.

The decomposition

In the quarter ended 30 April, Synopsys grew revenue 41.9% to $2.28bn and raised full-year guidance to $9.665bn at the midpoint. Underneath, gross margin fell 783 basis points — nearly eight percentage points — to 72.3%, and reported operating margin went from 23.5% to 10.4%. Design Automation came in at $1,822m with core electronic-design-automation revenue up just over 8%, while Design IP fell about 6% year on year to $454m. Gross profit dollars did rise, up 28.4% over the trailing year — the acquisition is additive in dollars and dilutive in margin, simultaneously.

Chief executive Sassine Ghazi told investors on the 27 May call that the fix is a change in how the IP business charges: "by the end of this fiscal year, we will have few customers with signed agreements with a new business model that provides the opportunity to capture more dollar than the traditional use fee or some level of NRE" — non-recurring engineering fees, the one-time charges that have historically capped what a chip-IP vendor collects when a customer's design ships in volume. Synopsys has also agreed to sell its Processor IP business to GlobalFoundries, closing in the second half of this year, to concentrate on interface and foundation blocks.

The other half of the duopoly

Cadence, which sells the competing tools plus Palladium emulation and Protium prototyping boxes, has had the opposite quarter and the same tape. Revenue growth accelerated for a third straight quarter to 24.2%, gross margin held at 84.9%, and backlog reached a record $8.1bn, up 27%. Core electronic-design-automation revenue rose 18%, design IP more than 40% and system design and analysis 37%, with non-GAAP operating margin at 45.5%; management called the accompanying raise "the highest we have raised annual revenue in a single quarter." Full-year guidance is $6.26–6.34bn, and assumes export rules stay substantially as they are. Cadence shares are down 8.2% over twelve months while trailing gross profit grew 18.6%. It has not yet announced a third-quarter date; its last results filing was 27 July.

Because an 85% gross margin and a 72% one make sales comparisons meaningless, the useful cross-name anchor is price against a dollar of trailing gross profit. Cadence has fallen to 17.0 times from 20.0 in late July and roughly 21.8 a year ago, with no reported deterioration in between. Synopsys sits at 12.0, up from a 10.3 low in late July but well below 14.0 in early May. Cadence remains 42% dearer inside a two-firm market.

What is earned and what is not

Synopsys's de-rating is paid for: a shrinking IP line and eight points of gross margin are exactly the things that ought to cost a stock its rating. Cadence's is not. The one shared shock was 17 July, when a Chinese laboratory showed an open-weight model completing a chip design with no proprietary tools at all and both fell about 9% in a session — on a 45nm library several generations behind where either company competes. The long-bond selloff of mid-August, with the 30-year Treasury at its highest since 2007, hit Synopsys harder than Cadence over that week, the reverse of what duration alone predicts given Cadence's thinner free-cash-flow yield. The likelier reading is that money is paying for margin quality rather than for design activity, and that record backlog at Cadence has so far bought nothing.

Synopsys goes first, on Wednesday, and for once the cheaper name sets the terms.

Paylocity Guided Fiscal 2027 on Flat Client Headcount; Paycom Cut Its Own Staff 21%

Hypothesis Opus 5 · Research Opus 5 · Writing Opus 5 · Prompt v1.6

Two mid-cap payroll vendors bill largely by the employee, and the employees have stopped arriving. Paylocity's fiscal 2027 forecast assumes client workforce levels are flat; ADP's count of employees on client payrolls grew 1% last fiscal year. Price is doing the work instead — Paylocity's revenue per client rose 5.4% to about $37,200 while its client count grew 7%.

The two share moves came by different routes. Paycom's arrived the session after it raised full-year profit guidance on an operating margin of 31.7%, against 23.2% a year earlier, having cut more than 500 roles it said artificial intelligence could do. Most of Paylocity's gain predates its own numbers, and 1.2 to 1.4 percentage points of next year's margin improvement comes from stretching an amortization schedule by a year.

PAYCPCTYADPPAYXWDAYPayroll & HCM SoftwarePer-Employee Pricing ModelsWhite-Collar Hiring SlowdownAI Labor SubstitutionModule Attach & UpsellMargin Accounting Quality
TickerCompanySegmentTrend · 13mo30D1Y
The subject · what this brief is about
PAYCPaycom SoftwareHR & Workforce Management🌱 Emerging Bull+41.6%−1.4%
PCTYPaylocityHR & Workforce Management🔴 Cont. Bear+27.1%−15.9%
Compared against · context, not the story
ADPAutomatic Data ProcessingHCM Software & Payroll🌱 Emerging Bull+6.3%−7.0%
PAYXPaychexHCM Software & Payroll🌱 Emerging Bull+13.7%−8.7%
WDAYWorkdayEnterprise Resource Planning🌱 Emerging Bull+25.2%−9.6%

12-month price & trend

PAYC
Paycom Software
229
+2.35 (+1.04%)
vs. prior close
Price20d50d150d
PAYC 12-month price
HR & Workforce Management
PCTY
Paylocity
153
+0.98 (+0.64%)
vs. prior close
Price20d50d150d
PCTY 12-month price
HR & Workforce Management
ADP
Automatic Data Processing
281
+1.60 (+0.57%)
vs. prior close
Price20d50d150d
ADP 12-month price
HCM Software & Payroll
TickerMkt capP/EP/E fwdP/SP/S fwdP/GPP/GP fwdEV/EBITDAFCF yld
PAYC$10.3B24.3x19.0x4.8x4.7x6.0x5.8x12.4x7.3%
PCTY$8.2B30.7x17.4x4.6x4.3x6.7x6.3x16.2x5.5%
ADP$110.8B25.3x22.6x5.0x4.8x10.5x9.9x17.6x4.5%
PAYX
Paychex
124
+1.28 (+1.03%)
vs. prior close
Price20d50d150d
PAYX 12-month price
HCM Software & Payroll
WDAY
Workday
200
+2.69 (+1.36%)
vs. prior close
Price20d50d150d
WDAY 12-month price
Enterprise Resource Planning
TickerMkt capP/EP/E fwdP/SP/S fwdP/GPP/GP fwdEV/EBITDAFCF yld
PAYX$32.8B20.1x16.7x5.2x5.0x7.0x6.8x12.8x6.6%
WDAY$52.4B62.1x18.6x5.3x4.9x7.0x6.5x33.2x5.7%

Consensus projections

TickerFY2026EFY2027EFY2028E
PAYCRevenue+7.7%+7.1%+8.4%
EPS+30.8%+14.6%+9.8%
PCTYRevenue+11.1%+7.5%+7.6%
EPS+15.4%+9.0%+9.7%
ADPRevenue+7.0%+5.9%+5.7%
EPS+11.0%+10.6%+9.3%
PAYXRevenue+16.5%+5.4%+5.4%
EPS+10.1%+7.6%+6.5%
WDAYRevenue+13.4%+11.8%+11.0%
EPS+26.5%+18.6%+17.3%

Forward fiscal years only. Blank means no analyst coverage for that year.

Paylocity, which sells cloud payroll and human-capital software to mid-sized American employers and is paid largely by the employee, built its fiscal 2027 forecast on the assumption that its clients' payrolls stop growing. Chief financial officer Ryan Glenn told investors on the August 4 call that client workforce levels had risen in the June quarter and year on year, but that next year's guidance assumes them flat.

That assumption is the whole industry's problem stated politely. A per-employee-per-month subscription is arithmetically a census of the customer's white-collar workforce, and the census has flattened: ADP's pays-per-control, the count of employees on client payrolls it bills for, grew 1% in fiscal 2026 and is guided to 0–1%. Combined employment across financial activities, information and professional services peaked in April 2023 and has fallen 2% since. Growth now has to come from price, from modules, or from the vendor's own cost line.

Paycom took it out of its own payroll

Paycom, a single-database payroll and human-capital platform for small and mid-sized employers, chose the cost line. It eliminated more than 500 roles on October 1 — concentrated in customer support and client implementation — explicitly to replace them with software, and ended 2025 with 5,770 employees, down about 21% in a year. "So our focus is product automation and that drives cost efficiencies in many areas, including labor," chief executive Chad Richison said on the August 5 call. Second-quarter revenue was $531.2m, up 9.8%, and operating margin reached 31.7% against 23.2%. Full-year adjusted profit guidance went up, to a roughly 46% margin at the midpoint.

Two qualifications survive that. The margin is a recovery, since Paycom's 2025 full-year operating margin fell to 27.6% from 33.7% in 2024. And its annual revenue retention was 91%, improving but below Paylocity's above-92% and ADP's record 92.1%. Employee records on the platform reached 7.4m, up 5% — and that figure includes new clients won, so same-store employment grew by less.
Paylocity took it out of the amortization schedule

Paylocity's answer was attachment. Clients reached about 44,400, up 7%, and average revenue per client rose 5.4% to roughly $37,200 — per-client dollars growing alongside the client count, which is what cross-selling scheduling, spend management and its Ignite AI assistant is supposed to look like. Recurring revenue accelerated to 12.4% growth in the June quarter. Then fiscal 2027 was guided to $1.880–1.895bn, about 7% growth against 11.0% delivered, and 1.2 to 1.4 percentage points of next year's margin gain comes from amortizing deferred contract costs over eight years instead of seven. On the call, Toby Williams said the company is focused on delivering value from its AI agents first and monetizing once enough of it lands. Paylocity still carries roughly 6,900 people against Paycom's 5,770 on a larger revenue base.
What the shares did, and what it cost

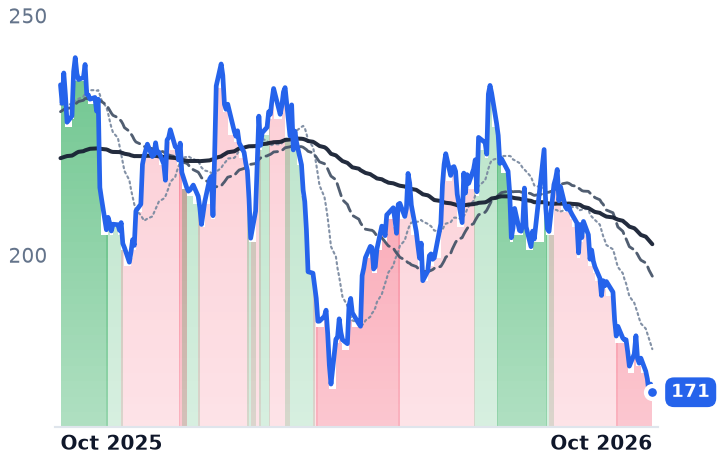
Paycom rose 64.4% in thirty days, and roughly a third of that came in the single session after its results, on more than three times normal volume. Paylocity's 27.0% was mostly earned before it disclosed anything: it gained 18.7% between July 22 and August 4, in the same window that carried Workday and other enterprise software names after Nvidia's Jensen Huang argued AI agents will use more software, not less. Its own earnings session added 1.8%. No rate cut was involved — the Federal Open Market Committee held at 3.50–3.75% on July 29, with three dissents for higher rates, and interest earned on client funds fell at both companies.

So the verdict splits cleanly. Paycom's advance is dated to disclosure and visible in the accounts, and it is the cheaper name after the larger move: 12.4x trailing enterprise value to EBITDA and a 7.3% free-cash-flow yield, against Paylocity's 16.2x and 5.5%. At 24.3x trailing earnings it sits where it traded in June 2025 on 17% more earnings and a share count cut a fifth by buybacks. Paylocity's re-rating to 30.7x trailing earnings rests on a business it has just guided to slower growth, with part of the improvement booked rather than operated.

The forecast that matters appears in neither income statement. One vendor has already tested how much of its own payroll its software can replace; the other is assuming its customers will not add to theirs. Both are now selling more product to the same people.

Accenture Retired Its AI Bookings Line and Booked 2% Less as $1trn Fled Chip Stocks

Hypothesis Opus 5 · Research Opus 5 · Writing Opus 5 · Prompt v1.6

Capital left the companies that build artificial-intelligence hardware in one late-July session and landed on the ones that install it. The businesses receiving it were, on their own last disclosures, slowing down.

Accenture's third-quarter new bookings fell 2% in dollars while headcount rose to 798,739, and it has retired the advanced-AI bookings line the market used to price the sector. Cognizant's quarterly bookings fell 6% and gross margin slipped to 33.4%; it trimmed constant-currency revenue guidance while raising earnings guidance on a shrinking share count. EPAM has the best evidence for the mechanism and the worst for the trade: AI-native work reached $160m, 11% of revenue, yet full-year organic guidance was cut to 2–3%.

Gross profit at the three grew 5.3%, 3.6% and 10.3%. Multiple expansion is nearly the whole move.

ACNCTSHEPAMINFYDXCGLOBIBMNVDAAVGOSPYAI-Enabled IT ServicesEnterprise Systems IntegrationAI Infrastructure CapexOffshore Delivery LaborBookings & Backlog TrendsAI Accelerator Demand
TickerCompanySegmentTrend · 13mo30D1Y
The subject · what this brief is about
ACNAccentureEnterprise Consulting & Systems Integration🔴 Cont. Bear+33.5%−27.1%
CTSHCognizant Technology SolutionsEnterprise Consulting & Systems Integration🔴 Cont. Bear+23.0%−13.7%
EPAMEPAM SystemsEnterprise Consulting & Systems Integration🔴 Cont. Bear+28.1%−36.9%
Compared against · context, not the story
INFYInfosysEnterprise Consulting & Systems Integration🔴 Cont. Bear−3.3%−30.1%
DXCDXC TechnologyIT Infrastructure & Operations🔴 Cont. Bear+16.5%−24.2%
GLOBGlobantEnterprise Consulting & Systems Integration🔴 Cont. Bear+29.4%−43.3%
IBMInternational Business MachinesIT Infrastructure & Operations⚠️ Emerging Bear+3.6%−0.8%
NVDANVIDIAAI & Data Center GPUs🟢 Cont. Bull+9.0%+20.6%
AVGOBroadcomSemiconductor Subsystems🟢 Cont. Bull−3.3%+26.0%
SPYState Street SPDR S&P 500 ETF TrustAsset Management🟢 Cont. Bull+3.4%+19.7%

12-month price & trend

ACN
Accenture
185
+1.15 (+0.62%)
vs. prior close
Price20d50d150d
ACN 12-month price
Enterprise Consulting & Systems Integration
CTSH
Cognizant Technology Solutions
61.87
+0.97 (+1.59%)
vs. prior close
Price20d50d150d
CTSH 12-month price
Enterprise Consulting & Systems Integration
EPAM
EPAM Systems
110
+3.58 (+3.35%)
vs. prior close
Price20d50d150d
EPAM 12-month price
Enterprise Consulting & Systems Integration
TickerMkt capP/EP/E fwdP/SP/S fwdP/GPP/GP fwdEV/EBITDAFCF yld
ACN$113.4B14.7x13.4x1.6x1.5x4.9x4.8x8.8x11.1%
CTSH$27.9B13.3x10.8x1.3x1.3x4.0x3.9x7.3x9.3%
EPAM$5.8B14.9x8.4x1.0x1.0x3.6x3.6x7.5x8.4%
INFY
Infosys
11.94
+0.11 (+0.93%)
vs. prior close
Price20d50d150d
INFY 12-month price
Enterprise Consulting & Systems Integration
DXC
DXC Technology
10.80
+0.08 (+0.73%)
vs. prior close
Price20d50d150d
DXC 12-month price
IT Infrastructure & Operations
GLOB
Globant
39.62
+0.28 (+0.71%)
vs. prior close
Price20d50d150d
GLOB 12-month price
Enterprise Consulting & Systems Integration
TickerMkt capP/EP/E fwdP/SP/S fwdP/GPP/GP fwdEV/EBITDAFCF yld
INFY$48.4B14.3x15.0x2.3x2.4x7.7x7.9x9.2x8.0%
DXC$1.8B14.2x4.2x0.1x0.1x1.0x1.1x2.6x71.4%
GLOB$1.6B14.1x5.8x0.6x0.6x2.0x2.0x6.3x20.3%
IBM
International Business Machines
236
+1.07 (+0.46%)
vs. prior close
Price20d50d150d
IBM 12-month price
IT Infrastructure & Operations
NVDA
NVIDIA
215
−2.13 (−0.98%)
vs. prior close
Price20d50d150d
NVDA 12-month price
AI & Data Center GPUs
AVGO
Broadcom
368
+4.42 (+1.21%)
vs. prior close
Price20d50d150d
AVGO 12-month price
Semiconductor Subsystems
TickerMkt capP/EP/E fwdP/SP/S fwdP/GPP/GP fwdEV/EBITDAFCF yld
IBM$222.5B20.6x19.2x3.2x3.2x5.5x5.4x17.3x6.6%
NVDA$5.5T34.3x25.0x21.5x13.9x29.0x18.7x28.3x2.2%
AVGO$1.8T59.5x31.8x23.2x16.6x34.7x24.8x42.8x1.9%
SPY
State Street SPDR S&P 500 ETF Trust
766
+2.42 (+0.32%)
vs. prior close
Price20d50d150d
SPY 12-month price
Asset Management
TickerMkt capP/EP/E fwdP/SP/S fwdP/GPP/GP fwdEV/EBITDAFCF yld
SPY$773.0B

Consensus projections

TickerFY2026EFY2027EFY2028E
ACNRevenue+6.0%+4.1%+5.3%
EPS+7.6%+5.9%+7.3%
CTSHRevenue+5.2%+4.7%+5.3%
EPS+10.8%+9.7%+10.4%
EPAMRevenue+3.9%+3.5%+5.0%
EPS+15.1%+7.3%+7.6%
INFYRevenue+1.6%+4.2%+3.6%
EPS+2.3%+4.4%+4.4%
DXCRevenue−1.2%−4.1%−1.4%
EPS−5.6%−18.4%+14.1%
GLOBRevenue+1.0%+4.4%+5.2%
EPS+1.6%+6.1%+7.3%
IBMRevenue+5.0%+3.9%+5.1%
EPS+8.4%+6.8%+8.6%
NVDARevenue+65.1%+84.2%+43.2%
EPS+59.0%+91.7%+42.0%
AVGORevenue+66.8%+66.1%+34.5%
EPS+71.8%+68.7%+34.8%

Forward fiscal years only. Blank means no analyst coverage for that year.

On 29 July the Federal Reserve held rates and the chip complex shed more than $1trn in a session, on fears that AI infrastructure spending was peaking faster than expected. Money did not leave the AI trade that day. It moved one rung down it. Over the three sessions ending 29 July, Accenture — the professional-services firm whose product is billable hours on cloud, cybersecurity and AI programs for large enterprises — rose 24.8%, Cognizant 29.6% and EPAM 23.3%, while the S&P 500 fell 2.4% and Nvidia fell 10.4%. Infosys, DXC Technology, Globant and IBM moved with them.

The wager is legible: if the silicon build is topping, the spending migrates to the people who make the software work inside banks and hospitals. That would make the labor rung of the AI stack a beneficiary rather than the victim the market has priced for a year. The last four quarters of disclosure from these three companies do not yet corroborate it.

Accenture: bookings down, heads up, disclosure gone

Accenture's quarter to 31 May, reported 18 June, produced new bookings of $19.3bn, down 2% in dollars and 3% in local currency, against revenue of $18.7bn — a book-to-bill near 1.03. Headcount rose 1% to 798,739. Revenue grew 3% in local currency against that 1% more staff: a two-point productivity gain, which is a firm running slightly leaner, not a re-architected pyramid. Gross profit grew 5.3% and margin was flat near 32.8%. Bright spots exist — 104 client bookings above $100m year-to-date, up 13%, and an operating margin of 17.0%.

The more consequential disclosure is one that ended. Accenture told investors the first quarter of fiscal 2026 would be the last in which it breaks out advanced-AI bookings, on the grounds that the technology is now embedded in nearly everything it sells. The final figure was $2.2bn, double the prior year, atop roughly $11.5bn booked cumulatively against $4.8bn of cumulative advanced-AI revenue — more than half the backlog still unconverted. "We are seeing more large-scale AI transformation programs, while executing our strategy to capture new areas of growth," chief executive Julie Sweet said with the June results. The shares fell 17.9% that day and dragged Cognizant and EPAM down with them.

Cognizant: flat heads, cheaper deals

Cognizant, the offshore-heavy consulting and outsourcing firm serving banks, insurers and health plans, reported second-quarter revenue of $5.5bn on 29 July — the same session as the chip rout. Trailing-twelve-month bookings rose 5% to $29.1bn, a book-to-bill of about 1.3, but bookings in the quarter itself fell 6%. Gross margin compressed to 33.4% from 33.7%, so gross profit grew 3.6% against revenue up 4.5%. Constant-currency revenue guidance was trimmed to 4.0–5.5% while adjusted earnings guidance was raised to $5.70–$5.82 — arithmetic helped by a diluted share count down from 497m to 466m since late 2024, with $1.1bn repurchased in the quarter alone.

Cognizant also supplies the clearest evidence for the decoupling thesis. Fixed-price and transaction-based work has grown as a share of mix for three straight years, and clients are asking for AI-infused rate cards that bundle training and inference costs. Chief financial officer Jatin Dalal told investors on the July call that headcount would stay "range-bound" as efficiency offsets the hiring of 20,000 graduates. Flat heads against mid-single-digit growth is the model the bulls describe — arriving at mid-single-digit growth. Management's own demand check: one in four Global 2000 companies have paused AI deployments.

EPAM: the mechanism works, the volume does not

EPAM, the digital platform-engineering outsourcer, is the purest test. AI-native revenue hit $160m, 11% of the business and a sixth consecutive quarter of double-digit sequential growth. Non-GAAP gross margin rose 190 basis points on price increases and better fixed-fee profitability; reported gross profit grew 10.3% on revenue up 4.5%, the only genuine operating leverage in the group. Yet organic constant-currency growth was 3.4%, the Americas — 57% of revenue — grew 0.5% against EMEA's 10.9%, and full-year guidance was cut to 2–3% organic. The shares closed down 14.5% on 6 August. "Coding gets automated, engineering doesn't," chief executive Balazs Fejes said on that call. His large agentic-managed-services pipeline has closed nothing yet; meaningful revenue was pushed to the first half of 2027.

What the move is made of

Over a month Accenture gained 31.5%, Cognizant 41.8% and EPAM 23.7%, and gross profit at the three grew 5.3%, 3.6% and 10.3%. Almost the entire re-rating is multiple. The mitigation is the starting point: Accenture trades at 13.4x forward earnings against 14.7x trailing with an 11.1% free-cash-flow yield, still 36% below its high and below a $255 Morningstar fair value; Cognizant at 10.8x forward, under the 14–15x that had been its reference; EPAM at 3.6 times trailing gross profit and the same forward, meaning no gross-profit growth is expected at all. Cheap is a fact here. Turning is not yet.

The verdict splits by name. EPAM has earned a pricing story and no volume one. Cognizant has earned flat headcount and buybacks, and is discounting deals to get them. Accenture has earned two points of productivity and lost its bookings momentum. What no disclosure explains is why these businesses were worth a quarter to two-fifths more in a month, and the likelier reading is that the market repriced a rotation narrative rather than a result.

Accenture's fiscal year ended 31 August, and the year-end print lands in late September. It will be the first one without the advanced-AI bookings line the sector used to argue with.

Crown Castle's Revenue Fell a Fourth Straight Quarter as DISH Shutdowns Cost It $240m

Hypothesis Opus 5 · Research Opus 5 · Writing Opus 5 · Prompt v1.6

Five landlords own the ground the communications industry sits on, carry similar debt loads and are discounted against the same long bond — and over twelve months they split entirely along their tenant lists. The tempting explanation is that rates de-rated the towers while artificial-intelligence leasing re-rated the data centers. The dates say otherwise: American Tower, SBA Communications and Crown Castle all rolled over into downtrends in the last week of July, on their own quarters, weeks before the 30-year yield hit its 19-year high.

Crown Castle's June-quarter revenue fell 4.9% to $1.008bn and its gross profit fell 17.8%, with consensus 2026 earnings of $1.92 a share sitting 22% below the trailing $2.46. Equinix's revenue growth accelerated to 16.4% over the same four quarters, with operating margin widening to 25.3%. The towers are being priced for shrinkage rather than mispriced for it.

CCIEQIXDLRAMTSBACCell Tower LeasingCarrier Network ConsolidationTenant Credit RiskREIT Leverage & RatesAI Capacity Buildout
TickerCompanySegmentTrend · 13mo30D1Y
The subject · what this brief is about
CCICrown CastleWireless & Fiber Infrastructure🔴 Cont. Bear−0.3%−24.6%
EQIXEquinixData Center & Colocation🌱 Emerging Bull+3.0%+37.0%
DLRDigital Realty TrustData Center & Colocation🟢 Cont. Bull−1.3%+16.6%
Compared against · context, not the story
AMTAmerican TowerWireless & Fiber Infrastructure🔴 Cont. Bear+2.5%−14.6%
SBACSBA CommunicationsWireless & Fiber Infrastructure🔴 Cont. Bear+4.4%−17.1%

12-month price & trend

CCI
Crown Castle
75.51
−0.31 (−0.41%)
vs. prior close
Price20d50d150d
CCI 12-month price
Wireless & Fiber Infrastructure
EQIX
Equinix
1,065
−17.22 (−1.59%)
vs. prior close
Price20d50d150d
EQIX 12-month price
Data Center & Colocation
DLR
Digital Realty Trust
191
−3.68 (−1.89%)
vs. prior close
Price20d50d150d
DLR 12-month price
Data Center & Colocation
TickerMkt capP/EP/E fwdP/SP/S fwdP/GPP/GP fwdEV/EBITDAFCF yld
CCI$33.0B30.6x39.3x7.9x8.2x12.5x12.9x20.4x7.3%
EQIX$105.1B68.3x61.8x10.7x10.2x20.7x19.8x28.4x1.3%
DLR$70.5B87.8x70.4x10.3x10.0x74.8x72.4x25.5x1.9%
AMT
American Tower
176
−0.88 (−0.50%)
vs. prior close
Price20d50d150d
AMT 12-month price
Wireless & Fiber Infrastructure
SBAC
SBA Communications
183
+1.53 (+0.85%)
vs. prior close
Price20d50d150d
SBAC 12-month price
Wireless & Fiber Infrastructure
TickerMkt capP/EP/E fwdP/SP/S fwdP/GPP/GP fwdEV/EBITDAFCF yld
AMT$80.4B23.7x25.1x7.3x7.3x10.0x10.0x17.6x4.9%
SBAC$19.5B19.8x24.1x6.8x6.8x10.6x10.7x16.4x6.4%

Consensus projections

TickerFY2026EFY2027EFY2028E
CCIRevenue−5.0%+1.3%+2.3%
EPS+106.7%+47.3%+4.8%
EQIXRevenue+11.0%+10.6%+11.4%
EPS+16.8%+9.3%+10.4%
DLRRevenue+16.9%+11.1%+14.1%
EPS−26.0%−5.5%+25.1%
AMTRevenue+4.0%+3.3%+5.9%
EPS+34.5%+1.4%+10.5%
SBACRevenue+1.5%+2.4%+3.7%
EPS−22.6%+10.0%+11.5%

Forward fiscal years only. Blank means no analyst coverage for that year.

Crown Castle collected less rent in the June quarter than it had a year earlier, for the fourth quarter running. Revenue at the company, which leases vertical space on more than 40,000 US cellular towers to mobile carriers, fell 4.9% to $1.008bn as the old Sprint and DISH networks kept coming off its structures — a headwind management sized at $240m for the full year, on top of a persistent $60m drag from straight-line lease accounting.

That is the awkward fact beneath a comparison the market has made all year. The five largest listed US communications landlords own similar things: long-lived assets, leases measured in years, heavy debt, and a valuation discounted against the same long bond, which touched 5.323% on 18 August, its highest since 2007. Over the twelve months to 21 August they separated entirely by tenant list — Equinix up 38% and Digital Realty up 16.4%, against American Tower down 16.2%, SBA Communications down 17.3% and Crown Castle down 26.6%. The question is whether artificial-intelligence leasing is genuinely being repriced into the ground, or whether the discount rate did all the work and the labels came later.

The dating settles it

The rate move is common to all five and explains none of the separation. Across the two sessions bracketing that 19-year-high yield print, the group fell together and within a point of each other: Equinix lost 1.5%, Digital Realty 2.5%, American Tower 1.9%, SBA 2.1% and Crown Castle 2.6%. And the towers had already broken down before it. All three flipped into a sustained downtrend — 50-day average crossing below the 200-day — in the last week of July, Crown Castle on the 20th and American Tower and SBA within two days of it, in the immediate wake of their own second-quarter reports. Rates hit an already-repriced group.

What is actually shrinking

Crown Castle's organic growth ran 3.9% in the quarter, 4.2% excluding DISH, and management told the 22 July call that 2026 marks the "low point for organic growth," pointing to 3.6% through the cycle and noting that over 90% of this year's organic growth is already contracted. It nudged full-year adjusted funds from operations guidance up $5m to a $2.1bn midpoint. The same tenant-credit problem sits at SBA Communications, which excluded all contracted EchoStar revenue from its 2026 guidance over non-payment.

Capital allocation has not softened it. Crown Castle put the $8.4bn of fiber-sale proceeds into roughly $7bn of debt repayment and a $1bn buyback of 11.3m shares at an average $88.66 — about 15% underwater against the 21 August close of $75.51 — leaving net leverage at 6.3x. Management did disclose early-stage edge data-center trials at tens to low hundreds of kilowatts per tower, requiring no incremental capital. That is an option, not a rent roll.

The other tenant list

Equinix, which rents cabinets and cross-connects inside 273 campuses rather than leasing whole buildings, grew revenue 16.4% in the June quarter with operating margin at 25.3%, up from 20.5% four quarters earlier. Diluted shares rose 1.1% year over year while adjusted funds from operations per share rose 18% — the dilution channel that usually eats a landlord's growth is not open here. "This is the largest single guidance raise in the history of our company, reflecting broad-based durable demand and strong execution across our business," chief executive Adaire Fox-Martin said on the 29 July call. The cost is visible: capital expenditure guided to $5-6bn this year, leverage heading toward 4.6x, and blended cost of capital guided up about 150 basis points.

Digital Realty, which leases wholesale hyperscale halls across 309 data centers, grew revenue 28.9% and finished the quarter with a record $1.9bn backlog at full share, equal to roughly 30% of in-place data-center revenue. It has $20bn under construction at an 11.5% average stabilized yield, against €800m of 4.250% notes due 2037 issued last November. Its share count rose 4.6%, four times Equinix's pace, partly to fund the $3.5bn Blackstone Northern Virginia deal.

Where the multiples went

Equinix trades at 20.73x trailing gross profit, below the 21.64x recorded in mid-May — cheaper after a 38% year, because profit outran price. Digital Realty's price-to-sales is 10.30x against 11.14x in May, and its reported gross-profit line is distorted by a reclassification, so revenue is the workable comparison. Crown Castle went the other way: 12.55x gross profit now against 12.05x on 3 May, despite an 18% three-month decline, because gross profit fell faster than the shares. Its forward price-to-earnings of 39.3x sits above its trailing 30.6x, consensus 2026 earnings of $1.92 landing 22% under the trailing $2.46. It yields 7.29% on trailing free cash flow, against 1.94% at Digital Realty and 1.30% at Equinix.

So the honest split: the data-center landlords earn their advance in the income statement, and the tower de-rating is the market marking down a rent roll that is genuinely contracting rather than mispricing a bond proxy. What nothing in the fundamentals explains is timing at the margin — Equinix's trend upgrade landed on 21 August, twenty-three sessions after the guidance raise and on a day the shares fell 1.6%, with no dated disclosure behind it beyond a $28m expansion in Bogotá. That is a lagging average catching up to a summer's drift.

Crown Castle's cleanest path back to growth is not a lease at all. It is a $3.5bn bankruptcy claim against DISH, and a $2.4bn escrow that only pays if the AT&T–EchoStar spectrum deal closes.

CrowdStrike Sped Up Three Quarters Running. Its Peers Re-Rated Faster Than They Grew.

Hypothesis Opus 5 · Research Opus 5 · Writing Opus 5 · Prompt v1.5

Three of the largest listed security-software companies have risen together since May, and the market has treated them as one trade. Their income statements say they are not. CrowdStrike's revenue growth accelerated for a third straight quarter, to 25.6%, and its gross margin widened 150 basis points to 75.3% — gross profit grew faster than sales. Cloudflare grew faster still, 35.9%, but its cost of revenue rose 52.7% and its reported gross margin slipped to 71.8%. Palo Alto Networks has published nothing since April, when acquisitions supplied roughly a fifth of its recurring-revenue growth.

Priced against trailing gross profit, the divergence is sharper: since late May Palo Alto's multiple rose 37% on gross profit that did not change at all, Cloudflare's 27%, CrowdStrike's 9%. The run broke on 13 August, when 30-year Treasury yields hit a 19-year high. CrowdStrike reports on 26 August.

CRWDNETPANWZSOKTAFTNTQLYSSTENBCHKPAKAMDDOGDOCNCybersecurity SoftwareEndpoint & Cloud ProtectionSaaS Gross MarginsAI Agent TrafficAcquisition-Fueled ARRLong-Bond Yields
TickerCompanySegmentTrend · 13mo30D1Y
The subject · what this brief is about
CRWDCrowdStrikeCybersecurity & Threat Protection⚠️ Emerging Bear+5.6%−54.4%
NETCloudflareNetwork & Application Delivery🌱 Emerging Bull+11.0%+49.4%
PANWPalo Alto NetworksCybersecurity & Threat Protection🌱 Emerging Bull+12.2%+92.5%
Compared against · context, not the story
ZSZscalerAI & Data Intelligence🔴 Cont. Bear+19.9%−33.3%
OKTAOktaIdentity & Access Management🌱 Emerging Bull−0.8%+46.8%
FTNTFortinetNetwork Security Appliances🌱 Emerging Bull+2.4%+91.8%
QLYSQualysCybersecurity & Threat Protection🌱 Emerging Bull+36.1%+35.3%
SSentinelOneCybersecurity & Threat Protection🌱 Emerging Bull+15.5%+24.9%
TENBTenableCybersecurity & Threat Protection🌱 Emerging Bull+9.6%+12.1%
CHKPCheck Point Software TechnologiesCybersecurity & Threat Protection🔴 Cont. Bear+3.6%−31.4%
AKAMAkamai TechnologiesNetwork & Application Delivery🟢 Cont. Bull−1.2%+42.2%
DDOGDatadogData & Analytics Platforms🟢 Cont. Bull−6.1%+79.6%
DOCNDigitalOceanCloud Infrastructure & Platforms🟢 Cont. Bull−0.2%+256.3%

12-month price & trend

CRWD
CrowdStrike
192
+1.61 (+0.85%)
vs. prior close
Price20d50d150d
CRWD 12-month price
Cybersecurity & Threat Protection
NET
Cloudflare
293
+14.23 (+5.10%)
vs. prior close
Price20d50d150d
NET 12-month price
Network & Application Delivery
PANW
Palo Alto Networks
358
+8.31 (+2.38%)
vs. prior close
Price20d50d150d
PANW 12-month price
Cybersecurity & Threat Protection
TickerMkt capP/EP/E fwdP/SP/S fwdP/GPP/GP fwdEV/EBITDAFCF yld
CRWD$195.5Bn/m155.9x38.4x32.9x51.1x43.8x572.8x0.7%
NET$104.0Bn/m232.5x41.4x36.3x57.0x50.0x0.4%
PANW$291.7B300.7x87.2x27.5x21.1x38.2x29.3x127.9x1.5%
ZS
Zscaler
182
+6.79 (+3.88%)
vs. prior close
Price20d50d150d
ZS 12-month price
AI & Data Intelligence
OKTA
Okta
135
+0.98 (+0.73%)
vs. prior close
Price20d50d150d
OKTA 12-month price
Identity & Access Management
FTNT
Fortinet
154
+2.72 (+1.80%)
vs. prior close
Price20d50d150d
FTNT 12-month price
Network Security Appliances
TickerMkt capP/EP/E fwdP/SP/S fwdP/GPP/GP fwdEV/EBITDAFCF yld
ZS$29.7Bn/m40.1x9.4x7.6x12.2x9.9x251.1x3.2%
OKTA$23.5B100.9x36.7x7.8x7.3x10.1x9.5x64.2x3.8%
FTNT$117.4B55.9x46.8x15.6x14.5x19.4x18.1x39.7x2.7%
QLYS
Qualys
182
−1.59 (−0.87%)
vs. prior close
Price20d50d150d
QLYS 12-month price
Cybersecurity & Threat Protection
S
SentinelOne
21.19
+0.33 (+1.58%)
vs. prior close
Price20d50d150d
S 12-month price
Cybersecurity & Threat Protection
TENB
Tenable
34.38
+0.10 (+0.29%)
vs. prior close
Price20d50d150d
TENB 12-month price
Cybersecurity & Threat Protection
TickerMkt capP/EP/E fwdP/SP/S fwdP/GPP/GP fwdEV/EBITDAFCF yld
QLYS$3.2B15.9x11.9x4.6x4.4x5.6x5.3x11.4x9.2%
S$7.2Bn/m61.3x6.9x6.0x9.3x8.1xn/m0.6%
TENB$2.4Bn/m11.0x2.3x2.2x3.0x2.8x23.3x11.1%
CHKP
Check Point Software Technologies
131
−0.19 (−0.15%)
vs. prior close
Price20d50d150d
CHKP 12-month price
Cybersecurity & Threat Protection
AKAM
Akamai Technologies
110
+0.33 (+0.30%)
vs. prior close
Price20d50d150d
AKAM 12-month price
Network & Application Delivery
DDOG
Datadog
236
+3.07 (+1.32%)
vs. prior close
Price20d50d150d
DDOG 12-month price
Data & Analytics Platforms
TickerMkt capP/EP/E fwdP/SP/S fwdP/GPP/GP fwdEV/EBITDAFCF yld
CHKP$12.9B12.3x11.9x4.7x4.6x5.5x5.4x14.3x10.1%
AKAM$16.1B38.9x16.4x3.7x3.6x6.6x6.3x18.6x3.9%
DDOG$83.9B473.9x93.2x21.1x18.8x26.6x23.6x321.8x1.4%
DOCN
DigitalOcean
112
−2.01 (−1.76%)
vs. prior close
Price20d50d150d
DOCN 12-month price
Cloud Infrastructure & Platforms
TickerMkt capP/EP/E fwdP/SP/S fwdP/GPP/GP fwdEV/EBITDAFCF yld
DOCN$13.5B45.9x79.6x13.4x11.5x23.4x20.1x38.1x0.1%

Consensus projections

TickerFY2026EFY2027EFY2028E
CRWDRevenue+22.2%+23.7%+21.8%
EPS−1.2%+32.6%+26.5%
NETRevenue+33.7%+28.7%+27.5%
EPS+38.0%+32.5%+35.3%
PANWRevenue+24.3%+21.2%+14.2%
EPS+15.3%+8.8%+17.7%
ZSRevenue+25.2%+16.9%+16.7%
EPS+29.0%+11.2%+17.6%
OKTARevenue+12.0%+10.0%+9.5%
EPS+24.3%+11.7%+10.9%
FTNTRevenue+19.8%+11.3%+10.9%
EPS+27.0%+9.4%+13.3%
QLYSRevenue+8.6%+7.0%+6.6%
EPS+8.6%+9.2%+5.3%
SRevenue+22.4%+19.9%+17.6%
EPS+723.4%+83.7%+43.0%
TENBRevenue+8.4%+7.1%+6.9%
EPS+27.0%+10.5%+10.1%
CHKPRevenue+3.2%+6.0%+5.6%
EPS−7.5%+9.6%+9.1%
AKAMRevenue+7.2%+12.8%+10.8%
EPS−4.7%+6.1%+13.9%
DDOGRevenue+31.7%+22.3%+22.9%
EPS+25.3%+17.0%+22.2%
DOCNRevenue+31.2%+53.5%+43.7%
EPS−29.0%+23.2%+60.4%

Forward fiscal years only. Blank means no analyst coverage for that year.

A dated test, four days out

CrowdStrike, which sells endpoint, identity and cloud-workload protection as subscriptions through its Falcon platform, reports quarterly results after the close on Wednesday, 26 August. It is the only one of the three largest listed security-software companies with numbers due this week. Palo Alto Networks follows on 1 September; Cloudflare last reported on 6 August.

The business heading into that print is speeding up, which is rare at this size. April-quarter revenue was $1.386bn, up 25.6% — a third consecutive quarter of faster growth, from 21.3% four quarters earlier. Gross margin widened 150 basis points to 75.3%, so gross profit grew 28.1%, ahead of sales. Annual recurring revenue (ARR) ended at $5.51bn, up 24%, with a record first-quarter addition of $255.8m in net new ARR, up 32%. Free cash flow reached $468m, and management raised full-year net new ARR growth guidance by 520 basis points at the midpoint.

The price history was misleading

Anyone scanning CrowdStrike's summer chart saw what looked like a wipeout: about $701 in late June, roughly $186 days later. That was a four-for-one stock split, approved on 3 June and effective 2 July. Adjusted, the shares are up about 98% since 20 February and 61% since early May. CrowdStrike participated fully in the security advance; only the unadjusted series suggests otherwise.

Where the re-rating outran the earnings

All three are loss-making under generally accepted accounting principles (GAAP), so price against gross profit is the lens that survives the comparison. Measured that way, since 22 May Palo Alto went from 27.8 to 38.2 times trailing gross profit — a 37% increase on gross profit that did not change at all, because it has reported nothing since April. Cloudflare went from 44.9 to 57.0 times, up 27%, while its gross-profit dollars grew 6.8%. CrowdStrike went from 47.0 to 51.1 times, up 9%, on gross-profit dollars up 6.4%. One of the three re-rated roughly in line with what it earned.

Cloudflare, which routes and filters traffic for websites from its own global network, has the loudest demand story: revenue up 35.9% to $696.1m, the fastest in two years, dollar-based net retention of 120%, and 4,698 customers spending over $100,000 a year, up 27%. But cost of revenue grew 52.7% as network capacity landed in cost of goods, pulling GAAP gross margin to 71.8% from 74.9%. Management says more than half the traffic on its network is now AI agents rather than people. None of that appears as a disclosed product revenue line; the crawler tolls and payment gateways are announced, not itemized.

Palo Alto, the firewall vendor now bundling security subscriptions around its hardware, reported next-generation security ARR of $8.1bn, up 60% — but $1.6bn of that arrived with CyberArk and Chronosphere. Gross margin fell to 67.6% from 72.9%, and the quarter carried a GAAP operating loss of $183m.

The bond market ended the run, not the customers

All seven of the big security names peaked in the same session, 13 August. Then the 30-year Treasury yield printed above 5.33%, its highest in 19 years, on 18–19 August. Cloudflare fell 15.7% into the 20 August trough and CrowdStrike 15.6%, against 8.9% at Fortinet and 7.0% at Zscaler. The losses sorted by multiple, not by security demand. The partial bounce on 21 August followed the Treasury Department saying it would at least double its debt-buyback size.

What has to print

Sell-side previews put the bar for Wednesday at roughly $292m of net new ARR, more than 3% above CrowdStrike's own guidance. The durable part of the case is consolidation: gross retention near 97%, with endpoint, identity, cloud workload and security-analytics modules sold onto one agent, which is how CrowdStrike takes budget from single-product vendors. The durable threat is Microsoft, which bundles competing security into licences enterprises already buy. Consensus already assumes revenue growth of 23.7% this fiscal year — the acceleration is in the price before it is in the release.

The setup

Where it stands — CrowdStrike's growth and margins improved into a print due 26 August, on a multiple that rose less than its peers' since May.

Would confirm — Net new ARR above $292m with gross margin holding at or above 75%.

Would invalidate — Net new ARR below the roughly $255m added a year ago, or a sequential gross-margin decline.

Watch next — Fiscal second-quarter results after the close on 26 August; Palo Alto's fiscal fourth quarter on 1 September.

Valuation — 51.1x trailing gross profit and 43.8x forward, against 47.0x in late May; 38.4x trailing sales.

Jacobs Gets 11% of Fee Revenue From AI Data Centers, and Trades Below Tetra Tech

Hypothesis Opus 5 · Research Opus 5 · Writing Opus 5 · Prompt v1.5

Four engineering consultancies draw the AI build — the interconnection studies, substation layouts and water permits that precede any groundbreaking — and only one has told investors how much of that work it holds. Jacobs Solutions puts AI data centers at 11% of adjusted net revenue, with that backlog doubled and the pipeline tripled, and its shares are unchanged over twelve months. Tetra Tech's data-center practice runs near $60m a year, about 1.4% of guided revenue, and trades at 23.5x forward earnings — above Jacobs at 20.7x.

The catch is how the money arrives. Jacobs' revenue grew 34.6% last quarter while gross profit rose 7.3%, and gross margin fell about five points; Tetra Tech's revenue rose 13.5% and its gross profit fell. Stantec, which sells design only and won Meta's Alberta campus mandate, posted a record 18.7% quarterly margin. AECOM shows what construction risk costs: a $337m charge.

JTTEKSTNACMPWRMYRGEMEFIXWSCUTIWSP.TOAI Data-Center BuildoutEngineering & Design ConsultanciesGrid Interconnection & SubstationsFixed-Price Construction RiskBacklog & Pass-Through MarginsWater & Environmental Permitting
TickerCompanySegmentTrend · 13mo30D1Y
The subject · what this brief is about
TTEKTetra TechDesign & Engineering Consulting🔴 Cont. Bear+10.4%+0.8%
STNStantecDesign & Engineering Consulting🔴 Cont. Bear+3.2%−33.0%
ACMAecomDesign & Engineering Consulting🔴 Cont. Bear−13.0%−46.9%
Compared against · context, not the story
JJacobs SolutionsDesign & Engineering Consulting🔴 Cont. Bear+6.0%+0.8%
PWRQuanta ServicesElectrical & Power Infrastructure🟢 Cont. Bull+11.0%+72.0%
MYRGMYRElectrical & Power Infrastructure🟢 Cont. Bull−8.8%+67.5%
EMEEMCORElectrical & Power Infrastructure🟢 Cont. Bull+10.0%+27.5%
FIXComfort Systems USAMEP & Building Systems🟢 Cont. Bull+1.8%+140.4%
WSCWillScotModular & Portable Storage🌱 Emerging Bull−13.9%−10.3%
UTIUniversal Technical InstituteCareer & Technical Training🌱 Emerging Bull−42.8%−16.7%
WSP.TOWSP GlobalEngineering & Construction🔴 Cont. Bear+9.1%−33.0%

12-month price & trend

J
Jacobs Solutions
149
+0.91 (+0.61%)
vs. prior close
Price20d50d150d
J 12-month price
Design & Engineering Consulting
TTEK
Tetra Tech
37.00
+0.42 (+1.16%)
vs. prior close
Price20d50d150d
TTEK 12-month price
Design & Engineering Consulting
STN
Stantec
74.07
+0.42 (+0.57%)
vs. prior close
Price20d50d150d
STN 12-month price
Design & Engineering Consulting
TickerMkt capP/EP/E fwdP/SP/S fwdP/GPP/GP fwdEV/EBITDAFCF yld
J$17.7B52.3x20.7x1.2x1.9x5.6x8.4x22.8x3.6%
TTEK$9.6B22.2x23.5x1.9x2.2x10.1x11.7x15.6x5.7%
STN$8.4B23.0x16.5x1.4x1.2x3.3x2.7x12.3x5.7%
ACM
Aecom
64.79
−1.00 (−1.52%)
vs. prior close
Price20d50d150d
ACM 12-month price
Design & Engineering Consulting
PWR
Quanta Services
653
−15.38 (−2.30%)
vs. prior close
Price20d50d150d
PWR 12-month price
Electrical & Power Infrastructure
MYRG
MYR
311
−7.04 (−2.21%)
vs. prior close
Price20d50d150d
MYRG 12-month price
Electrical & Power Infrastructure
TickerMkt capP/EP/E fwdP/SP/S fwdP/GPP/GP fwdEV/EBITDAFCF yld
ACM$8.3B29.3x16.3x0.5x1.1x9.5x19.7xn/m2.4%
PWR$96.1B72.3x38.2x2.9x2.4x20.3x16.9x33.7x2.5%
MYRG$4.8B29.2x25.5x1.2x1.1x9.7x8.9x16.2x4.0%
EME
EMCOR
777
−9.82 (−1.25%)
vs. prior close
Price20d50d150d
EME 12-month price
Electrical & Power Infrastructure
FIX
Comfort Systems USA
1,656
−10.82 (−0.65%)
vs. prior close
Price20d50d150d
FIX 12-month price
MEP & Building Systems
WSC
WillScot
22.14
+0.14 (+0.64%)
vs. prior close
Price20d50d150d
WSC 12-month price
Modular & Portable Storage
TickerMkt capP/EP/E fwdP/SP/S fwdP/GPP/GP fwdEV/EBITDAFCF yld
EME$34.3B24.3x23.6x1.8x1.7x9.4x8.6x14.9x3.4%
FIX$58.3B40.7x33.8x5.2x4.5x20.2x17.5x29.0x3.7%
WSC$4.0Bn/m19.8x1.7x1.7x3.6x3.6x21.8x13.4%
UTI
Universal Technical Institute
22.35
+0.00 (+0.00%)
vs. prior close
Price20d50d150d
UTI 12-month price
Career & Technical Training
WSP.TO
WSP Global
191
+0.40 (+0.21%)
vs. prior close
Price20d50d150d
WSP.TO 12-month price
Engineering & Construction
TickerMkt capP/EP/E fwdP/SP/S fwdP/GPP/GP fwdEV/EBITDAFCF yld
UTI$1.2B35.6x37.0x1.4x1.4x2.3x2.2x14.0x-1.9%
WSP.TO$23.1B23.3x14.9x1.3x1.4x7.3x8.1x13.3x7.5%

Consensus projections

TickerFY2026EFY2027EFY2028E
JRevenue−20.4%+6.2%+6.1%
EPS+19.7%+14.2%+15.6%
TTEKRevenue−3.5%+4.3%+1.8%
EPS+4.1%+10.2%+11.4%
STNRevenue+12.6%+6.0%+4.8%
EPS+17.0%+11.8%+12.3%
ACMRevenue−1.6%+7.2%+5.8%
EPS−24.1%+55.1%+18.1%
PWRRevenue+40.6%+16.7%+12.5%
EPS+57.5%+17.8%+16.7%
MYRGRevenue+22.9%+15.5%+11.4%
EPS+72.5%+18.4%+22.2%
EMERevenue+21.4%+10.9%+8.3%
EPS+30.1%+13.0%+13.2%
FIXRevenue+47.4%+20.2%+17.6%
EPS+86.6%+22.8%+23.4%
WSCRevenue+2.3%+2.6%+4.7%
EPS−0.3%+16.3%+35.2%
UTIRevenue+7.7%+8.5%+10.9%
EPS−42.9%+22.9%+70.5%
WSP.TORevenue+18.9%+7.5%+6.9%
EPS+19.5%+14.6%+13.8%

Forward fiscal years only. Blank means no analyst coverage for that year.

Every AI data center begins as paperwork — an interconnection study, a substation layout, a water-withdrawal permit, a stamped set of drawings. Jacobs Solutions, a Dallas-based engineering and consulting firm of about 47,000 people, is the only large firm in that business that has told investors how much of the work it now holds.

AI data-center build-out reached 11% of Jacobs' adjusted net revenue — the fee base that remains after subcontractor and equipment costs pass through — in its fiscal third quarter, up roughly a point from the previous three months. Management said the related backlog has doubled and the pipeline tripled, with client visibility stretching from six-to-nine months out to two or three years. Engineering News-Record ranks Jacobs the largest data-center design firm. In the quarter it took a sole-source engineering, procurement and construction-management award from Hut 8 for Beacon Point, a 1GW campus in Texas due for first energization in 2027, following the River Bend campus in Louisiana. Company-wide backlog hit a record $29bn, up 27%, and Jacobs raised full-year adjusted earnings guidance for a third consecutive quarter, to $7.20-7.30 a share.

The shares are worth what they were a year ago.

The fee and the pass-through

Part of the answer is in how the AI money arrives. Jacobs' revenue grew 34.6% to $4.08bn last quarter while gross profit grew 7.3%. Gross margin fell from 24.9% to 19.9%, and net income dropped 26.7%. Construction-management dollars inflate the top line and carry almost no margin with them.

Tetra Tech, a Pasadena consulting firm of about 25,000 people split between US government agencies and commercial water, energy and mining clients, shows the same arithmetic more starkly. Revenue rose 13.5% to $1.31bn in its June quarter while gross profit fell 3.3% to $243.2m, a 323 basis-point margin compression. Across three quarters revenue growth accelerated — 1.1%, then 10.6%, then 13.5% — and gross profit fell in every one. Its data-center practice runs at roughly $60m annualized; its Ukraine reconstruction work for the US Department of State billed $66m in the quarter alone. The federal-cuts story told about Tetra Tech is also backwards: US federal revenue grew 12% while US commercial grew 1%, offshore-wind cancellations offsetting data-center and mining gains. The company raised fiscal 2026 guidance on 30 July to revenue of $4.315-4.365bn and earnings of $1.56-1.59 a share.

The firms that refuse the construction risk

Stantec, an Edmonton-based design and environmental consultancy of about 34,000 people, takes the opposite route: fees for drawings and studies, no construction exposure. Net revenue rose 11.5% to C$1.8bn in the second quarter, of which 3.7% was organic, and adjusted earnings per share rose 18.4% to C$1.61. Adjusted margin reached a record 18.7% for a second quarter. Backlog set a record at C$9.2bn, up 17.5% and 7.0% organically, about thirteen months of work; its US book grew to C$5.5bn from C$4.6bn. Its buildings team was selected to design Meta's $13bn campus in Sturgeon County, Alberta — the largest named AI-campus design mandate any of these firms has disclosed. The soft spot is domestic: US organic growth was flat, as a Navy environmental job and a Western utility project ramped slower than planned.

AECOM, a 51,000-person infrastructure consultancy, demonstrated in one session what construction risk costs a design firm. It booked a $337m pretax charge on a 2018-vintage public-private design-build contract, attributed in analyst notes to the JFK Airport modernization program. June-quarter revenue fell 14.2% to $3.59bn, the company posted a net loss of $86.7m, and adjusted earnings of -$0.50 a share missed a $1.51 consensus. Free-cash-flow guidance was cut to $300m from $400m, with about $500m of cash draining out through the first half of fiscal 2027. Orders said the reverse: record backlog of $27.8bn, up 13%, at a 1.6x quarterly book-to-burn. Management has said it will not bid public-private design-build again, and that construction management is 6-7% of net service revenue.

Demand is not the constraint. Pennsylvania's governor removed data centers from the state's permit fast-track program on 18 August, requiring any project drawing 25MW or more to sign a consent agreement with the environmental regulator — mechanically adding review and interconnection work of exactly the kind these four firms sell.

What the prices say

AECOM sits near 10.5x consensus fiscal 2027 earnings of $6.17, and 10.8x management's own ex-charge figure of $6.00 — against 22-24x forward as recently as May. Stantec is 23.0x trailing, down from 28.95x in early May, roughly 21.5x forward on a like-for-like currency basis, with a 5.7% free-cash-flow yield. Tetra Tech's 23.5x forward sits above its 22.2x trailing, meaning analysts model earnings lower than the past year's. Jacobs is 20.7x forward — the cheapest forward multiple of the three that disclose growing data-center work, and the only one with a quantified AI number behind it.

Over twelve months AECOM fell 47% and Stantec 33%, while Jacobs and Tetra Tech went nowhere. The contractors that build what these firms draw compounded: Comfort Systems rose 140%, Quanta Services 72%, EMCOR 27%. The market has priced the design rung as one class and has not yet separated the firm with the biggest disclosed AI book from the ones describing it in adjectives.

The setup

Where it stands — Jacobs is the only large design firm quantifying AI exposure, at 11% of fee revenue, and carries a lower forward multiple than Tetra Tech's 1.4%. Would confirm — AI data centers exceeding 12% of adjusted net revenue in the October-quarter report with adjusted margin holding. Would invalidate — data-center backlog growth stalling, or fee margin falling further as pass-through revenue keeps climbing. Watch next — Jacobs' fiscal fourth-quarter results in November; Stantec's CEO handover to Susan Reisbord on 1 October. Valuation — Jacobs 20.7x forward against a distorted 52.3x trailing; Tetra Tech 23.5x forward, Stantec 23.0x trailing, AECOM ~10.5x fiscal 2027.